ASi" kUCTURE FlOR DEVELOPMENT
ASi" kUCTURE FlOR DEVELOPMENT
ASi" kUCTURE FlOR DEVELOPMENT
Create successful ePaper yourself
Turn your PDF publications into a flip-book with our unique Google optimized e-Paper software.
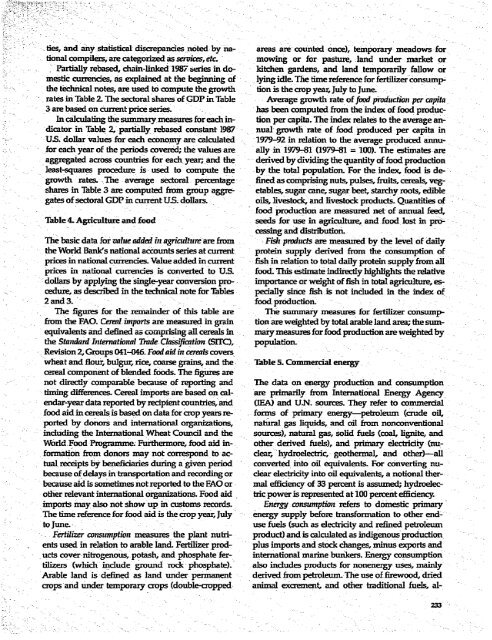
ties, and any statistical discrepancies notd by na- areas are counted once), temporary meadows for<br />
tional compilers, are categorized as sernices, etc. mowing or for pasture, land under market or<br />
Partially rebased, chain-linked 19857 benes in do- kitchen gardens, and land temporarily fallow or<br />
mestic currencies, as explained at the beginning of lying idle. The time reference for fertilizer consumpthe<br />
technical notes, are used to compute the growth lion is the crop year, July to June.<br />
rates in Table 2. The sectoral shares of GDP in Table Average growtlh rate of food prTducUon per capita<br />
3 are based on current pnce series. has been computed from the index of food pmduc-<br />
In calculating the summary measures for each in- tion per capita. The index relates to the average andicator<br />
in Table 2, partially rebased constant 1987 nual growth rate of food produced per capita in<br />
US. dollar values for each economy are calculated 1979-92 in relation to the average produced annufor<br />
each year of the periods covered; the values are ally in 1979-81 (1979481 = 100). The estimates are<br />
aggregated across countres for each year; and the derived by dividing the quantity of food production<br />
least-squares procedure is used to compute the by the total population. For the index, food is degrowth<br />
rates. -The average sectoral percentage fined as comprsing nuts, pulses, fruits, cereals, vegshares<br />
in Table 3 are computed from group aggre- etables, sugar cane, sugar beet, starchy roots, edible<br />
gates of sectoral GDP in current US. dollars.<br />
oils, livestock, and livestock products Quantities of<br />
food production are measured net of annual feed,<br />
Table 4 Agriculture and food<br />
seeds for use in agriculture, and food lost in processing<br />
and distribution.<br />
The basic data for value added in agriculture are from Fishz products are measured by the level of daily<br />
theWorld Bank's national accounts series at current protein supply derived from the consumption of<br />
prices in national currences. Value added in current fish in relation to total daily protein supply from all<br />
prices in national currencies is converted to US. food. This estmate indirecdy highlights the relative<br />
dollars by applying the single-year conversion pro- importance or weight of fish in total agriculture, escedure,<br />
as descnbed in the technical note for Tables pecially since fish is not included in the index of<br />
2 and 3- food production.<br />
The figures for the remainder of this table are The summary measures for fertilizer consumpfrom<br />
the FAO. Cereal buports are measured in grain tion are weighted by total arable land area; the sumequivalents<br />
and defined as comprisMg all cereals in mary measures for food production are weighted by<br />
the Standard Internationtal Trade Classufifcation (SITC), population.<br />
Revision 2, Groups 041-046. Food aid in cereals covers<br />
wheat and flour, bulgnr, rice, coarse grains, and the Table 5. Commercial energy<br />
cereal component of blended foods. The figures are<br />
not directly comparable because of reporting and The data on energy production and consumption<br />
timing differences. Cereal imports are based on cal- are primarily from International Energy Agency<br />
endar-year data reported by recipient countnes, and (EA) and U.N. sources. They refer to commercial<br />
food aid in cereals is based on data for crop years re- forms of primary energy-petroleum (crude oil,<br />
ported by donors and international organizations, nahtual gas liquids, and oil from nornconventional<br />
including the International Wheat Council and the sources), natural gas, solid fuels (coal, lignite, and<br />
World Food Programme. Furthermore, food aid in- other derived fuels), and primary electricity (nuformation<br />
from donors may not correspond to ac- dear, hydroelectric, geothermaL and otherf)-all<br />
tual receipts by beneficiaries during a given period converted into oil equivalents- For converting nubecause<br />
of delays in transportation and recording or dear electricty into oil equivalents, a notional therbecause<br />
aid is sometimes not reported to the FAO or mal efficiency of 33 percent is assumed; hydroelecother<br />
relevant international organizations. Food aid tric power is represented at 100 percent efficiency<br />
imports may also not show up in customs records. Energy consumption refers to domestic pnrmary<br />
The time reference for food aid is the crop year, July energy supply before transformation to other endto<br />
June.<br />
use fuels (such as electricity and refined petroleum<br />
Fertilizer consumption measures the plant nutri- product) and is calculated as indigenous production<br />
ents used in relation to amble land. Fertilizer prod- plus imports and stock changes, minus exports and<br />
ucts cover nitrogenous, potash, and phosphate fer- international marine bunkers. Energy consumption<br />
tlizers (which indude ground rock phosphate). also includes products for nonenergy uses, mainly<br />
Arable land is defined as land under permanent derived from petroleum. The use of firewood, dried<br />
crops and under temporary crops (double-copped animal excrement, and other traditional fuels, al-<br />
233


