Table A.1 (continuald) Pavrd roads; EILrtrid! y-gien:titig airMcity Ekdcrkiciy predutcfi io (hi binder) (U,ionusds of kilouwalts) (induhrnvs ofkibloauf4f-Iurs) Colnnhy 1960 1970 1980 1990 1960 2970 2980 2990 1960 2970 2980 1990 Wght-incuute economies 110 Ireland 33,315 71,593A 87.6779 86,764 725 1,630 3.15 3N807 2Z26-2 6,091 10.W5 14,516 III New Zealand. 22.277/ 40,599 47,0 52.410 1,566 3,79 5,927 7,504 6.35 13,706 21.982 30,159 112 tlszel .. 4,118 4,596 425 127 2Z832 4,135 2,313 6.55 12.525 20;729 113 Spain .. 94*656 150,831 239,582 6,567 177,9122 29.353 43.273 18*615 56.490. 110,483 150*33 114 fHong Kong 948 907 1,161 1,484 365 1.341 3.22 8.342) 1,301 5,097 12.649 28,938 115 Iinmgapare 323 1I20 2,180 2,75 152 644 1,90 3,400 699 2205 .6,940 15,620 116 Australia 50800 167,920 244,086 263,527 5,906 15.594 25.746i 36,782 23,19,7 53,89 95,891 154558 117 United Kingdom 319,314 334,232 339,804 356.517 36,70 62,06 73.643 73,05 136,971) 249.016 2854,937318,9776 118 [tlaIr. 26Z,188 285,319 303,906 17,68 30.408 46,824 56.549 56,240 117.421 155.741 216.922 119 Nedthelands 70.000 78-551 92,525 92,0(39 5,262 10,163 15.32 17,441 16.516 40,859 64,806 712874 1T0 Canada 138,515 186,939 164,160 2599210 23,035 42,526 81,999 104,140 114,3.75204,723 377.515 484.752- 121 Belgium 23.343 94,00 119,152 129.603 4,520] 6,257 11,005 14,140 15.152 30.52 53.6412 M70.19 127 Finland .. 234174 35,950 46,61 2.834 4,312 10,422) 13,220 8,628 21,186 38,7710 54,506 123 lUnited Arab Entitaes . . - .-. 124 France 626,44!] 690,950 730,697 741,152 21,85 362)19 62,I1 103,410 72,115 146,966 246,415 419,534 125 Austria 32063 94,83 106,303 125(0 4A08 7,976 12.930 16,839 15,965 30,036 41,96.6 50,416 126 Germanv 115,976 41,600 466,675 495,955i 25.393 417,540 52.585 99.750A 115,986 242,611 363.785 454,66 127 United States. 2.2021014,67.350 5,169,092 -186,534 360.327 630.111 725396% 844,1881,63,771 2Z354.384 3,031.02 128 Norway 12,28 46.579 61,356 6,0 290 20,238 27.195 31,121 57,606i 84.099 121,58 129 Dewnmark 41,28 50.676 68,909 71,063 1,953 4,488 6,768 9,133 5,179 2D,04 25.A38 25,728 130 Sweden 57,68i9 80,022 78,700 94,9017 . 5,37 27,416 34,1899 . 60,646 96,985 146534 131 Japan 37,785S 15-2,03 511,044 782.04 23.720, 68,7710 143,69 194,763 115.498 359.539 577.21 85-7,34 132 Swifteriand. 56-58 59,233 64.029 71,106 5,840 10.50 13,99 16.300 19,073 .33,173 45.33 a5,84 Sdedeed ecounoie not incduded in main WVDI tables Angola .. 5.3 . 7,914 88 3127 600 617 143 644 1I5O 1,540 Barbados 1216 1.158 1,45 1.399 122 39 94 140 38 146 332 468 Cyprus 1.71 3,596 5.097 5,452 85 185 269 471 .236 610 1,0134 1,975, FIJI. 267 1.20 9 54 117 200 55- 15 306 435 Gambia,The -. 282 462 549 4 9 11 13 5 13 40 67- Guyana 223. 713 4,829 52 160 162 114 92 323 419 22 Haiti 442) 551 585 629 28 43 .121 153 90 118 315 475 Iceland - . 3627 2.264 142- 353 743 9toi. 551 1,4770 3,155 4610 Iraq 7,316 4,77 f3 14,166 26,040 350 680 1,200 9,000 852 2.75 8.0 29,160 Kuw%ait .. .. 285P -. 6,79M. . 20,641 Liberi . 32 1,80 2,27 22 224 305 332 100 502 900 565 Luxembourg . ~~~~4.447 5X07 5,045 269 1,157, I'38 1,238 1,3 ,148 1.111 1,374 Malta .. .. ~~~~~~ ~~1,223 .. 2 110 122 250 67 285 5277 1.100 Surinarne 459 Z.- 23779 29 260 395 415 79 1,32 1,610 1,501 Swaziland .. 182 447 688 . . .- .- Zaire -. 2,110 2Z175- 2,500 650 86 1.716 2,831 2,456 3,230 4,160 6.155 (Table aontinks an tlrfacing pzge 142
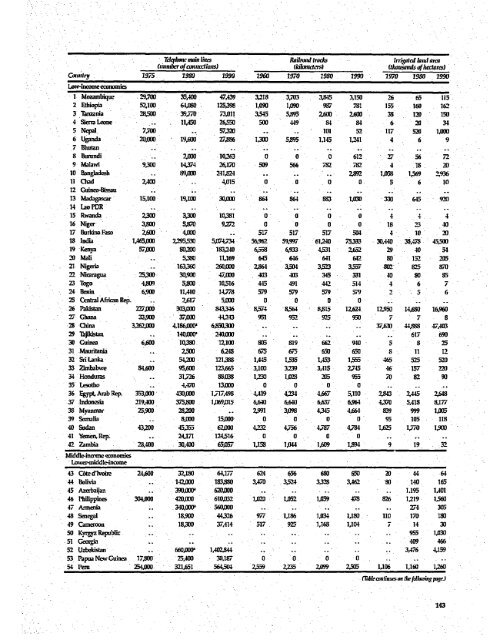
*TLqdqmrc Main (rsRaiilwad tracks Irrisrtrd Iaind arcv (simujbrrof arnnzrthmls) (kilomners) (tlzonsamds of hrdara) Coutiti 1j975 1980 1990 2960 197-0 1980 1990 2970 2980 1990 Lowv-income economies I Mozambique 29,7`00 35,400 417.439 3.218 3.703 3.845 3,150 26 65 115. 2 ELhiopia 53.100 64JJ80 125,39 11)9 1,090 987 7181 155 160 162- 3 Tanznia 211.500 39,771] 73.011 3.545 5.895 2.600 2.60 38 120 150 4 SierraLeorke . 11,450 26,550 500 4419 84 84 6 211 34 5 Nepal 770. 731 . - 101 52 117 51 20 6 Uganida 20,000 19,600 27.86 1,300 5.595 1.145 1,241 4 6 9 S8Buunmdi 2,000 10.26 0 0 .0 612 27 56 72) 9 Maalawi 9,300 14.374 26.17 0 509 566 782 78 4 15 20 10 Bangladesh -. 89f] 241.824 .. . .9 W iJIS 1,56 2936 11 Chad 2,40) - 4.015 0 a 0 0. 5 6 10 12 Guinea-Bissau .-. .- .. .- 13 Madagascar 15,100 19,100 30.00 86 564 883 .1.030 330 645 920 14 LaoFDR ..-- -- .. .- . - l5 Rwanda Z,300 3.3UO 10,38 0 0 0. 0 4 4 4 16 Niger 3005.870 9.27'2 a 0 0 0 is 23 40 17 Burkirna Faso 2.600 4.000 51 -. 17 517r 304 4 10 2) 18 India 1,465.00 25,25530 5.074,734 56,962) 59,997 612140 755333 30.440 38.475 45_500 19 Kenya 571)0 50.3)O 183,240 6,55 6,933 4,531 Z.652 29 40 54 20 mani. 5,380 11,169 645 646 641 632y so 152 205 2, Nigeriia -- 163,360 260.00 2.864 3.504 3.52 3,557, S02 825 87 22 Nhaoragua 25,300 30,900 4.00O0 403 403 345 331 40 so 85 23 Togo 4.5(1 5,500 10.516 445 491 442 514 4 67 24 Benint 6,900 11,410 . 14.-778 579 579 71 92 6 25 Central African Rep- - 617 SAM0 0a 0 0 a- -- - - 26 Pajdsza 27.000x 303,00 843,346 8,57-4 *5.56 8.815 12,62-4 12,9550 14,60 16.96 27 Chana 33,900 37oo43,0 5 95,2 92 5( 7 8 -28 China 3262.00 4.1866.O 6.8502300 3.. 63.-- 0 44.8 47,403 29 Tajlldtan -. 140,000 240110.. . . .- 617 690 30 Cuinea 6,60 10,380 12,100 505 819 662 910 5 8 25 31 -Mauritania .. 2.31 6,248 675 6751 650 650 8 11 12 32 Sri Lank-a -- 54,20 121388 1,445 1.535 1,453 1,555 465 5725 520 33 Zimbabw%e 84,00 95,600 123.665 3,100) 3.239 3.415 2Z745 46 157 220 34 Honduras .. 31.P26 58158 1,230 1I02 2(5 955 70 82 90 35tLesotho . 447 1300000 0-. - 36 Egyp Arab Rep. 353,000, 430J]0 1.71749S 4,419 4-234 4.667 5,110 2,843 2,445 2,64 37 Indonesia 219,400 375,500 1.0691)15 6,640 6.611] 6,637 6,964 4.370 5,415 8,177 38 Myamnar 25,900 28,20 .. 2991 3,098 4-345 4.664 839 999 1.00 39 Somialia SM 800 15.000 0 0 0 a) 95 105 118 40 Sudan 43,200 45,355 62A000 423 4,756 4.787 4.784 1.625 1.770O 1,9(X 41 YenmenRep. .. 24.1771 124.516 a 0 a 0 42- Zambia 28.400 30,400 651)57 1,158 1,044 1,609 1,894 9 19 .32 Midde-hiacnmeownomnies Lorwer-middle-income 43 Cote d'Ivoirw 24,600 52,1580 64.177 624 656 650 650 20 44 64 44 Bolivia .. 142,000 W5.55 3,470 3,524 3.328 3,462 .80 140 165 45 Azerbijar 390.000 620100.O- D. 1.195 1.401 46 Philppines 304,000 420J11 6102037 1.021) 1.052 47 Armenia .. 340,000 560.000.- ..... 12159 478 8326 1,219 27 1.56 30 48 Senegal . 18,90D 44.326 9771 1,186 1.04 115 110 170 150 49 Camerooa . 15,11 37,414 517. 925 1,168 1,104 7 14 30 50 Kvrgyz Republic -----. - -- 955 1I030 51lGeorgia ... . - ' . . 409 466 52 Uzbekislan .. 660,000 1,402.844 .- -.-. 3,476 4,159 53 Papua NewC uinea 17,00 25,400 -30.187 0 * 0 0 0 * - . .- 54 Peru 254.000 321,651 564.504 2,559 2.235 2.99 2.5(5 1.106 1,160I 1I2M 143
- Page 1 and 2:
3jQi'[~~~~~~~~~~~~~ ~~~~~~~ I -:A -
- Page 3 and 4:
... ..... Oxford University Prss :O
- Page 5 and 6:
-: .- : 7 - A- - .~ g ------ Vry. _
- Page 7 and 8:
. 6 Setting priorities and implemen
- Page 9 and 10:
3.1. Contractual anrangements for p
- Page 11 and 12:
Because of changes in GNP per capit
- Page 13 and 14:
- - Infrastruckure's roleand record
- Page 15 and 16:
L ~ ~ ~ ~ ~ ... ~ ~ ~ ~ ~ C- l' __
- Page 17 and 18:
Diagnosing the causes of poor perfo
- Page 19 and 20:
private sector have evolved. Port f
- Page 21 and 22:
tradability of infrastructure servi
- Page 23 and 24:
fits. The way ahead is one of 'cont
- Page 25 and 26:
Eior - 1 a iX for. - '1~t'*%~ E 6 -
- Page 27 and 28:
;~~~~~~~~~~~~~~~~~~~~~~~~~~~~~~W.:-
- Page 29 and 30:
BoxL12 The importance of infrastruc
- Page 31 and 32:
and reliability, as well as on quan
- Page 33 and 34:
Expansion of transport infrastructu
- Page 35 and 36:
Roads are not private goods, althou
- Page 37 and 38:
Table 1.3 Expansion of infrastructu
- Page 39 and 40:
: ~ ~ 2 A :0::~~~~~~~~~~~~~~ 9 0 0
- Page 41 and 42:
pie of Latin American water utiltie
- Page 43 and 44:
straint to their mobility (Figure 1
- Page 45 and 46:
Box 1.7 Infastiucture activities ti
- Page 47 and 48:
* Option A: Public ownership and op
- Page 49 and 50:
Lessons of success and failure mana
- Page 51 and 52:
-~~~~o 22, -Svrac pa eae layoffs tt
- Page 53 and 54:
vices. These concerns are particula
- Page 55 and 56:
Management conitracting wHEN is Ir
- Page 57 and 58:
- :. : : . - I- ~~*r~ 4.~ accounts
- Page 59 and 60:
The best way of reducing the gap be
- Page 61 and 62:
the high rates of return for mainte
- Page 63 and 64:
l:: :: . - : 0~ ,aSn- ::~~~i /W-#H
- Page 65 and 66:
egional gas distributors, and an en
- Page 67 and 68:
5 : zFigre3C4mnbndbgl atvitie ices
- Page 69 and 70:
Helped in part by sectoral unbundli
- Page 71 and 72:
;t~~1F D ¢- l- e as is demnonstrat
- Page 73 and 74:
short-mn gain and skimp on routine
- Page 75 and 76:
Table 3.2 Value of infrastructure p
- Page 77 and 78:
Box 3.6 Telecom piivatizati6ci the
- Page 79 and 80:
Box 3.8 Regulation and privatizatio
- Page 81 and 82:
private management can become compl
- Page 83 and 84:
this chapter shows, where regulator
- Page 85 and 86:
transport ministries in Africa is o
- Page 87 and 88:
Unlodking local effort through- dec
- Page 89 and 90:
Box 4.3 Power in Purang and roads i
- Page 91 and 92:
->W>
- Page 93 and 94:
way of achieving distributional obj
- Page 95 and 96:
are bundled into low-cost loans to
- Page 97 and 98:
powerful minorities can capture the
- Page 99 and 100:
to this purpose without sacrificing
- Page 101 and 102:
found that although households were
- Page 103 and 104:
4 I~~~Z Box46 W canbenefitftbm ibut
- Page 105 and 106:
I Box. 4.9 Icroaigenviironmental. c
- Page 107 and 108:
. ............ --S - Financigneeded
- Page 109 and 110: Box 5.1 Is there a free lunch?-limi
- Page 111 and 112: Box 52 Tapping international capita
- Page 113 and 114: 1~~~~D Clt ,-,.Re -b cope an tie 0
- Page 115 and 116: V Box 5A A successfl-firtt step in
- Page 117 and 118: change risk through the passing on
- Page 119 and 120: Box 5.8 Look before you leap: limit
- Page 121 and 122: poor financial discipline, and subs
- Page 123 and 124: 'sv,t-za6oapioceeds (billions of VS
- Page 125 and 126: -~ f4' * ; ylkj XtLSidolkits.(1. -~
- Page 127 and 128: .*,mmr ''', '- ' f - .,__ -, 6.. -.
- Page 129 and 130: Box 6.1 Ingedientr. of good peromne
- Page 131 and 132: government and e strength of the co
- Page 133 and 134: = -ableb 6.Te tspbrhivaof jrnte' sc
- Page 135 and 136: elements of natural monopoly and mu
- Page 137 and 138: solid waste disposal through metrop
- Page 139 and 140: portant that uinstituitional activi
- Page 141 and 142: V-~~~~~~ : ~~~~ :: . = .-s Bibliogr
- Page 143 and 144: on. grwh once more sophisticated ec
- Page 145 and 146: structure and explain the importanc
- Page 147 and 148: 1993, Drtze and Stern 1987, Goldste
- Page 149 and 150: Ailken, J., G. Cromwell and C. Wish
- Page 151 and 152: Easterly, William and Sergio ReWo.
- Page 153 and 154: Paul, Samuel. 1991a. -Accomitabilit
- Page 155 and 156: Shirley; Mary and John Nellia 1991.
- Page 157 and 158: *:: Appendix: Infrastr cture data T
- Page 159: Piual aolai Ekd rkrilytarnyftig' nz
- Page 163 and 164: *Teplephmein lines Railnnd tmcts rs
- Page 165 and 166: Acress to safe drIPAIng zmfer Acem
- Page 167 and 168: Table AS3 IBRD and IDA commitments
- Page 169 and 170: * ;;\ * i Contents Key 154 Introduc
- Page 171 and 172: mairking Popzdaliou: hrf htt Total
- Page 173 and 174: .~ ~ ~ ~ ~ ~ ~ ~ ~ ~ ~ ~~~~~I .- In
- Page 175 and 176: into the following broad areas: pro
- Page 177 and 178: : - .~~~~~~~~~~~~~~~~~~~~~~~~~~~~~~
- Page 179 and 180: Pqm&uem Airs GN'perafii -AY an!A Uj
- Page 181 and 182: GDP AgmIrflun"y Alatmqjrmd Senrrk.
- Page 183 and 184: Disurihhhiuuefgrmd dmndprSarrf 11 G
- Page 185 and 186: Frnltioirruapm Food pnafaai fndia $
- Page 187 and 188: E-wapro&d-rrm &-VWrvaimdVf Penwifr
- Page 189 and 190: Drnbmdnlnfmafaaummtwdwhirdalf%J 197
- Page 191 and 192: 73 Ukraine.. ... 74 Algeria ~~~~~-.
- Page 193 and 194: Gewmt~ ~ Awgsaagsns 1 1970-80 *fl3)
- Page 195 and 196: Aimor GOUANWnk Gniadonmk piomm cama
- Page 197 and 198: D!~~me. MasSe limit ~~mar.w-fftw sf
- Page 199 and 200: Perauagrq JwL node riseiiv swim na
- Page 201 and 202: 19M410 1.931-9 Sm 193 199 I93-92 PM
- Page 203 and 204: hfar~uNzr,,~r(udWrnSIAwwunqem-fgmi.
- Page 205 and 206: 0hsrpflra Maudhmer& Dinf B21) 1992
- Page 207 and 208: P---rAgetrefurerd.ds&rcpans FiEs. n
- Page 209 and 210: 73 Ukruin 339 10.3 33.0 3.2 IDA) 43
- Page 211 and 212:
MD3 599 197f 19 197) 199 ami 1992 i
- Page 213 and 214:
OECD Net bilatral flows to 1ew4ineo
- Page 215 and 216:
~~~~~~~Fcquaa MSraefMIm Par iS&f WV
- Page 217 and 218:
TowdrreTaRr -- Inc~~t mz2 ]m im mm
- Page 219 and 220:
Dbimnsuzm pulEIMS) RqrsYWwsefpdnr4u
- Page 221 and 222:
* ~~~~~~~~~~~~~ToAd njinuc Net FDI
- Page 223 and 224:
Wpram agwofamdamrsdddirm S of~~~S.f
- Page 225 and 226:
Caiwhssu ~~~An iwqr6atwe A-ragromaB
- Page 227 and 228:
Tot 1.iS. 1lj9muksud Awiugnwf-guw*
- Page 229 and 230:
Cnd&bin CswkdtmuhArifuve rno fjrIUA
- Page 231 and 232:
1970 199 1971 POO0 199 1970 1992 1O
- Page 233 and 234:
_ _ __ _ _ _ _ _ _ * A~~~~~~~~ifm a
- Page 235 and 236:
Luje'ecam=rurabt @vs A&J a(nionrper
- Page 237 and 238:
PPPEJrImE4fGNp Tar Is seon N i Fe I
- Page 239 and 240:
M%qainl in. Elm arrarein 1992.. 5 %
- Page 241 and 242:
ParTr TdecImUmfaIUkdIS Pawr,! at Wa
- Page 243 and 244:
Taunt iFemifirnms Fwstr,srsuahmrd.
- Page 245 and 246:
E000 *t Technical notes' The main c
- Page 247 and 248:
practical and conceptual difficulti
- Page 249 and 250:
ties, and any statistical discrepan
- Page 251 and 252:
ily workers, they exdude homeworker
- Page 253 and 254:
and bxes not allocable to other cat
- Page 255 and 256:
derived from shorter-term stays are
- Page 257 and 258:
table, goods and services include w
- Page 259 and 260:
aise the isk of infant mortaliyand
- Page 261 and 262:
Columns 2 thrugh 7 give the shares
- Page 263 and 264:
the ICP Phase IV report, World Comp
- Page 265 and 266:
mation explicitly excludes decade-l
- Page 267 and 268:
t 1 Classfiction orec"onomuies by i
- Page 269 and 270:
Part 2 Clssfcation of economies by