ASi" kUCTURE FlOR DEVELOPMENT
ASi" kUCTURE FlOR DEVELOPMENT
ASi" kUCTURE FlOR DEVELOPMENT
You also want an ePaper? Increase the reach of your titles
YUMPU automatically turns print PDFs into web optimized ePapers that Google loves.
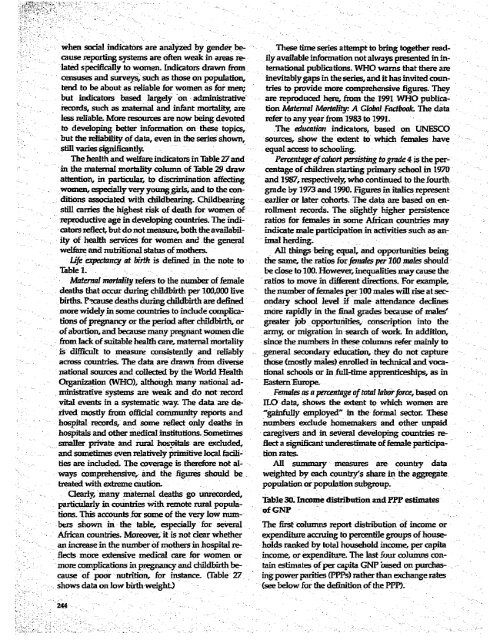
when social indicators are analyzed by gender be- These time series attempt to bring together readcause<br />
reporting systems are often weak in areas re- ily available information not always presented in inlated<br />
specificaliy to women. Indicators drawn fiom ternational publications. WHO warns that there are<br />
censuses and surveys, such as those on population, inevitablygaps in the series, and it has invited countend<br />
to be about as reliable for women as for men; tries to provide more comprehensive figures. They<br />
but indicators based largely on administrative are reproduced here, fnom the 1991 WHO publicarecords,<br />
such as maternal and infant mortality are tion Maternal Mortality: A Global Facdbook. The data<br />
less reliable. More resources are now being devoted refer to any year from 1983 to 1991.<br />
to developing better information on these topics, The education indicators, based on UNESCO<br />
but the reliability of data, even in the series shown, sources, show the extent to which females have<br />
still varies significantly.<br />
equal access to schooling.<br />
The health and welfare indicators in Table 27 and Percentage of colhort persisting to grade 4 is the perin<br />
the maternal mortality column of Table 29 draw centage of children starting primary school in 1970<br />
attention, in particular, to discrimination affecting and 1987, respectively, who continued to the fourth<br />
women, especially very young girls, and to the con- ggrade by 13 and 1990. Fgures in italics represent<br />
ditions associated with childbearing.Childbearing -earlier or later cohorts. The data are based on enstill<br />
cames the highest risk of death for women of rollment records. The slightly higher persistence<br />
reproductive age in developing countries. The indi- ratios for females in some African countries may<br />
cators reflect, but do not measure, both the availabil- indicate male partcipation in activities such as anity<br />
of health services for women and the general imal herding.<br />
welfare and nutnrtonal status of mothers. . All things being equal, and opportunities being<br />
Life expectmcy at birth is defined in the note to . the same, the ratios for females per 100 males should<br />
Table I.<br />
be dose to 100. However, inequalities may cause the<br />
Matera mortalty refers to the number of female ratios to move in different directions. For example,<br />
deaths that occur during childbirth per 100,000 live the number of females per 100 males wil rise atsecbirths<br />
Pxcause deaths during childbirth are defined ondary school level if male attendance declines<br />
more widely in some countries to include complica- more rapidly in the final grades because of males'<br />
d.ons of pregnancy or the period after childbirth, or greater job opportunities, conscription into the<br />
of abortion, and because many pregnant women die army, or migration in search of work In addition,<br />
from lack of suitable health care, maternal mortality since the numbers in these columns refer mainly to<br />
is difficult to measure consistently and reliably - general secondary education, they do not capture<br />
across countries. The data are drawn from diverse those (mostly males) enrolled in technical and vocanational<br />
sources and collected by the World Health tional schools or in fulI-time apprenticeships, as in<br />
Organization (WHO), although many national ad- EastenEurope<br />
ministrative systems are weak and do not record Females as a paretage of total laborforce, based on<br />
vital events in a systematic way The data are de- ILO data, shows the extent to which women are<br />
rived mostly from official community reports and "gainfuly employed" in the formal secor. These<br />
hospital records, and some reflect only deaths in numbers exclude homemakers and other unpaid<br />
hospitals and other medical institutions Sometimes caregivers and in seveal developing countries resmaller<br />
private and rural hosmitals are exduded, flect a significant underestimate of female participaand<br />
sometimes even relatively pnrmitire local facii- tion rates.<br />
ties are included. The coverage is therefore not al- All summary measures are country data<br />
ways comprehensive, and the figures should be weighted by each country's share in the aggregate<br />
treated with extreme caution.<br />
population or population subgroup.<br />
Clearly, many maternal deaths go unrecorded,<br />
-. - .partiularly in countries with remote rural popula- Table 30. Income distribution and FPP estimates<br />
dions. This acoDunts for some of the very low num- of GNP<br />
bers shown in the table, especially for seireral The first columns report distribution of income or<br />
African oDuntries. Moreover, it is not dear whether expenditure accruing to percentile groups of housean<br />
increase in the number of mothers in hospital re- holds ranked by total household income, per capita<br />
flects more extensive medical care for women or income, or expenditure. The last four columns conmore<br />
complications in pregnancy and childbirth be tain estimates of per capita CNP based on purchas<br />
cause of poor nutrition, for instance C(Table 27 ing power parities (PPPs) rather than exchange rates<br />
shows data on low birth weighL)<br />
(see below for the definition of the PPP).<br />
244


