

ASi" kUCTURE FlOR DEVELOPMENT
ASi" kUCTURE FlOR DEVELOPMENT
ASi" kUCTURE FlOR DEVELOPMENT

You also want an ePaper? Increase the reach of your titles
YUMPU automatically turns print PDFs into web optimized ePapers that Google loves.
Th quantityq , coverage, and quality of existing in- demand for infstructure will be growing rapidly.<br />
frastructre facilities and their effectiveness in The socialist economies in transition, by contrast,<br />
meeting present and future user demands define enpoy high coverage and relatively good technical<br />
what is needed. What. is possible is deterumned by a performance. The main challenge in these countries<br />
country's institutional capacity for commercial and is to reorient supply to meet the changing pattern of<br />
competitive servces in infrastructure-its manage- demand brought about by economic restructuring.<br />
rial and tedhnical capabilifies in the puolic and the Middle-income reforming economies have relaprivate<br />
sectors, the ability of government to ceate tively high infrastructure coverage but weaker peran<br />
enabliHng environment for private activity, and formance, especially in maintenance Improving efthe<br />
private sector's interest and reponsa The im- ficiency is their highest priority, in order to provide<br />
plications for reform are illustrated here for four the service- necessary to restart. growthl Highcountry<br />
types low-income countries, countries m growth economies have comparatively good covertransiLion<br />
from central planning, middle-income age and performance. For them the challenge is to<br />
countries undergoing economic reform (many meet rapidly expanding needs for infrastrucure of<br />
emerging from periods of low growth), and highgrowth<br />
countries.<br />
all types to sustain their 7 percent average annual<br />
gowth in output and to service the needs of urban<br />
populations growing by 4 percent a year-<br />
WnPx is NEEDED? The current suipply of services<br />
and the projecd growth, as well as changes, in de- WHAT FossiBLE? s The bounds of the possible are<br />
mand deterine pnorities in ifrastructure. Indica- drawn by eaich country's capaaty to implement retors<br />
of supply (ifrastructure coverage and per- forms, as defined by three characteristics. Frst is the<br />
formance) and demand (economic growth and country's managerial and technical capacity. Prodemographic<br />
shifts) vary considerably across the viding infrastructure is a techny complex activfour<br />
country types (Table 613-and so do their in- ity requiring engineers and other professionals, as<br />
frastructure needs Low-income economies tend to well as managers who understand the need to meet<br />
have both low coverage and poor performance; consumer demands- Second is the enabling ennearly<br />
every indicator of performance is on average vironment for beneficial private sector involvethree<br />
times worse than in OECD countries. And ment-both attracting investment and channeling<br />
with an urban population growth rate of 6 percent, it productively. The commitment and integrity of<br />
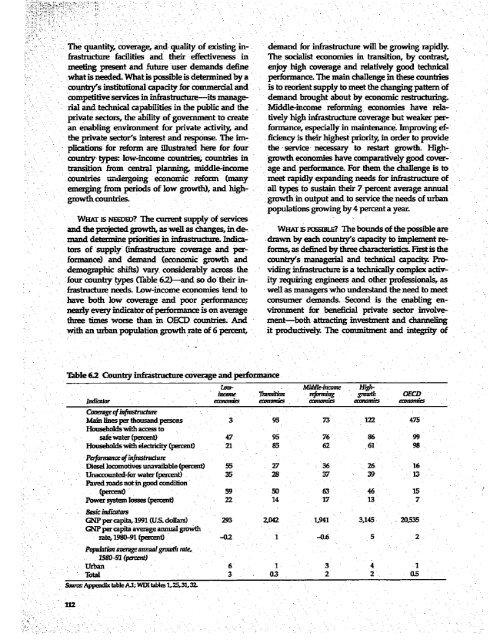
Table 62 Country infrastructure coverage and perfomance<br />
Law- ~~~~~Middk-inrom High-<br />
-ras Tr-nimcion rffwing gm- OECD<br />
Indicator econornis earnonsls erornmies auonasfie rrnasies<br />
Camgeof s-nuruw fh<br />
Main lines per thousand persons 3 95 73 122 475<br />
Households with access to<br />
safe water (percent) 47 95 76 86 99<br />
Households with electricty (Cperc 21 85 62 61 98<br />
Pafomtncrof infistnitunr<br />
Diesel locomotives unavailable (percent 55 27 36 26. 16<br />
Unacmunted-for water (percnt) 35 28 37 39 13<br />
vPaed roadsnotin good condition<br />
(percent) 59 50 63 46 15<br />
Power system losses (percent) 22 14 17 13 7<br />
- Basic indictms<br />
GNP per capita, 1991 (US. dollars) 293 2,042 1,941 3,145 20,535<br />
GNP per capita average annual growth<br />
rate, 1980-91 (percent) -0.2 1 -0.6 5 2<br />
Population rage annual gro7wth tL,<br />
.1980-91 (paent)<br />
: Urban - 6 1 3 4 1<br />
Total 3 0.3 2 2 0.5<br />
:SoAppendix tableA.1;WDItables,25,31.32-<br />
-..


