

ASi" kUCTURE FlOR DEVELOPMENT
ASi" kUCTURE FlOR DEVELOPMENT
ASi" kUCTURE FlOR DEVELOPMENT

Create successful ePaper yourself
Turn your PDF publications into a flip-book with our unique Google optimized e-Paper software.
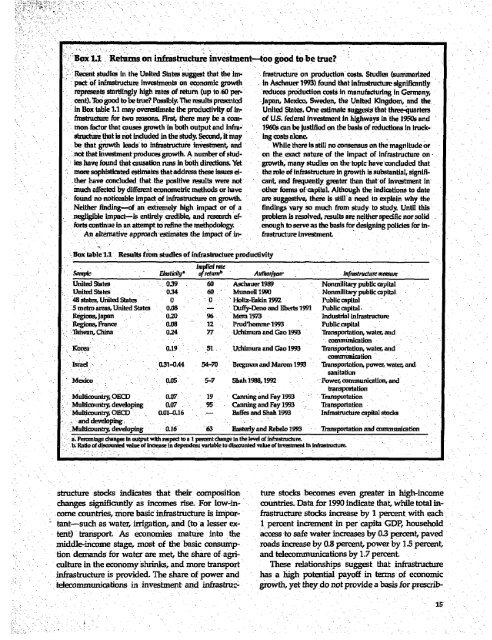
Bx1.1 Returns on infrastructure investment--too<br />
good to be true?<br />
Recent studies In the United Stae sgetthat thle mni- frawtructure on production costs. Studies (summarized<br />
pact of Infrastructure Investments on economice growth in Asehauer 1993) found that infrastrcture significantly<br />
represents startlingly high rats of retumn (up to.60 per- reduces production costs in manufacturing In Germany,<br />
cent). Toogood tobe true? Possibly. Thie resuitspresented Japan, Mexico, Sweden, the United Kingdom, and the.<br />
In Box taible 1.1 may overestimate the productivity of In- United States. One estimate suggests that threeupnrters<br />
frastructur for two reasns. First, there may be a cam- of ULS. federal Investmnent<br />
highways In the 1950s and<br />
rmon. factor thant causes growth In both output and infra- 1960s can be justified on the basis of reductions in truck-.<br />
structure fithtL risnt Included In the study. Second, it may lag costs alone.<br />
be that growth leads to infrastru tur tIvesTmet, and While there Is still no consensus on the magnitude or<br />
~no t thant iivestment-produces growth. A niumber of stud- on the exact nature of the Impact of infrastructure on<br />
les have found that causation runs In both directions. Yet -growth, many studies an the topic have concluded that<br />
more sophisticted estimates that address these Issues el- the role of Infrastructure In growth Is substantial signifi-<br />
-ther have concluded that the positive msuits were not cant and frequently greter than that'of investmnent In<br />
much affected by different econometric methods or have other (rnus of capital. Although the indications to date<br />
found no -noticeable impact of infrastructur on growth. are suggetive, ther'e is still'a need to explai-n why the<br />
Neither finding--.of an extremely~ high impact or of a findings vary so much from study to study Until this<br />
neglgble imnpact-is entirely credible, and research ef'- problem is resolved, results are neither specific nor solid<br />
forts continue in an attempt,to refine the methodology.<br />
.enough to serve as the basis for designing policies for in-<br />
An alterntive approach estinates the impact of in- frastructure investnienL.<br />
Box table 1.1 Results from studies of infrasiructure productivity<br />
NIaplfed rate<br />
Sample - Ekslkilyj o~~~f nrtumpb AaIlwr/ysrrr . 1sf rastrucdtureemmure<br />
United States 0.39 60 Aschauer 1989 .Nonmilitary public capital<br />
United States, 0.34 60 Munnell 1990 Nonmilitary public capital<br />
48 states, United States 0 0 Hot-ai 92Publiccapitol<br />
5metro area, United States 0.08 - utrDn n brs19 ulc capital.<br />
FRigions,japan 0.20 96. Mera 1973 Industrial infrastructure<br />
Regions, France 0.08 12 Prud'homrnr1993 . Public capitld<br />
Taiwan, China 0.24 77 Uchimunand Gao 1993 Transportation, water, and<br />
Korea. 0.19 5i.. Uchimuma and Gao 1993<br />
l[srael 0.31-0.44 54-70 Bregmnan and Marom 1993<br />
Mexico 0.05 ~~~~~~5-7 Shah 1988,1992<br />
-commnunication<br />
Transportation, water, and<br />
communication<br />
Transportation., power, water, and<br />
Poe,communication, and<br />
transportation<br />
Multicountry,-OECED 0.07 19 Canning and Fay 1993 -TrnmsPortation<br />
Multlcointzy, developing 0.07 95 Canning and Fay 1993 Transportation<br />
Mu1tiwuntry, OECD 0.01-0.16 - Bafies and Shah 1993 Infrastructure capital stodcks<br />
and deveoping.<br />
*MUtidCOuntry,~ developing 0.16 63 Easterly and Rebelo 1993 Thmsportation mid comimunicatio<br />
Percntage dhanges in output with impect to. a1 percet change In the level of(Infrastructume<br />
b. Ratio of discounted value of inemnse in depmenden variable to discounted value of InvestnienL<br />
infrast,ucttu.<br />
-a.<br />
strLucture stodcks indicates that their composition ture stocks becomes even greater in high-income<br />
* ch~~danges significantly as incomes rise. For low-in- countries. Data for 1990 indicate that, while total in-<br />
-come countries, more basic infr-astructure is impor- frastructure stodcks increase by 1 percent. with each.<br />
tant-such as water, -irrigation, and (to a lesser ex- 1. percent increment in per capita ODP, household<br />
tent) transport. As economries mature into the access to safe water increases by 0.3 percent, paved<br />
middle-income stage, most of the basic consump- roads increase by 0.8 percent, power by 1.5 percent,<br />
lion demands for water are met, the share of. agri- and telecommunications by 1.7 percent.<br />
culture in the economy'shrinks, and more transport These relationships suggest. that infrastructure<br />
infrastructure iLS provided. The share of power and has a high potential payoff in terms of economic<br />
telecommunications in.investment and infrastrw got,ythedontpviea basis for prescrib


