ASi" kUCTURE FlOR DEVELOPMENT
ASi" kUCTURE FlOR DEVELOPMENT
ASi" kUCTURE FlOR DEVELOPMENT
You also want an ePaper? Increase the reach of your titles
YUMPU automatically turns print PDFs into web optimized ePapers that Google loves.
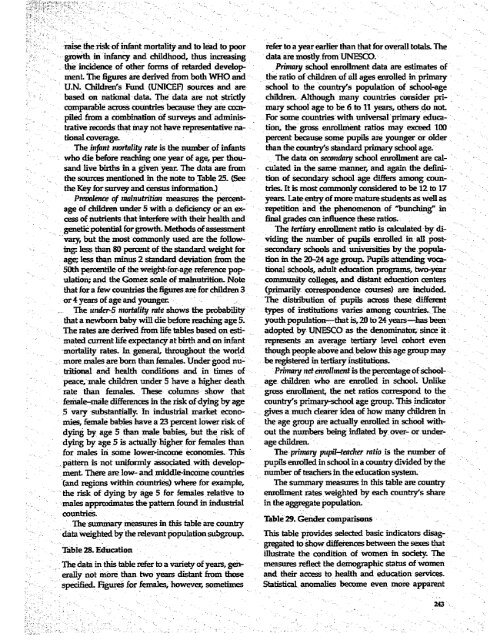
aise the isk of infant mortaliyand tolead topoor refer to a year earlier than that for overall totals. The<br />
growth im infancy and childhood, thus increasing data are mostly from UNESCO-.<br />
the incidence of other forms of retarded develop- Primary school enrollment data are estimates of<br />
menL The figures are derived from both WHO and the ratio of children of all ages enrolled in primary<br />
U.N. Children's Fund (UNICEF) sources and are school to the country's population of schoolage<br />
based on national data. The data are not strictly childrenL Although many countries consider pricomparabIe<br />
across countries because they are corn- mary school age to be 6 to 11 years, others do not.<br />
piled from a combination of surveys and admiinis- For some countries with universal primary educatrative<br />
records that may not have representative na- tion, the gross enrollment ratios may exceed 100<br />
tional coverage.<br />
percent because some pupils are younger or older<br />
The ijifant mortality rate is the number of infants than the country's standard primary school age.<br />
who die before reaching one year of age, per thou- The data on secondary school enrollment are calsand<br />
live births in a given year. The data are from culated in the same manner, and again the definithe<br />
sources mentioned in the note to Table 25i (See tion of secondary school ag differs among counthe<br />
Key for survey and census information) tries. It is most commonly considered to be 12 to 17<br />
Pnwalence of malnutrition measures the percent- years. Late entry of more mature students as vell as<br />
age of children under 5 with a deficiency or an ex- repetition and the phenomenon of "bunchingC in<br />
cess of nutrients that interfere with their health and final grades can influence these ratios.<br />
genetic potential for gowth. Methods of assessment The fertiary enrollment ratio is calculated by divary,<br />
but the most commonly used are the follow- viding the number of pupils enrolled in all postbng:<br />
less than 80 percent of the standard weight for secondary schools and universities bv the populaage;<br />
less than minus 2 standard deviation frm the tion in the 20-24 age group. Pupils attending voca-<br />
50th percentile of the weight-for-age reference pop- tional schools, adult education programs, two-year<br />
ulation; and the Gomez scale of malnutrition. Note community colleges, and distant education centers<br />
that for a few countries the figures are for children 3 (primarily correspondence courses) are induded.<br />
or4 years of age and younger<br />
The distnrbution of pupils across these different<br />
The under-5 mortality rate shows the probabili types of institutions varies among countries.The<br />
that a newbonm baby will die before reaching age 5. youth population-that is, 20 to 24 vears-has been<br />
The rates are derived from life tables based on esti- adopted by UNESCO as the denominator,- since it<br />
mated current life expectancy at birth and on infant represents an average tertiary level cohort even<br />
mortality rates. In general, throughout the world though people above and below this age group may<br />
more. males are born than females. Under good nu- be registered in tertiary institutions.<br />
tntional and health conditions and in times of Prnary net enrollment is the percentage of schoolpeace,<br />
imale children under 5 have a higher death age children who are enrolled in schooL Unlike<br />
rate than females. These columns show that gross enrollment, the net ratios correspond to the<br />
female-male differences in the risk of dying by age country's primary-school age group. This indicator<br />
5 vary substantially. In industrial market econo- gives a much dearer idea of how many children in<br />
mies, female babies have a 23 percent lower risk of the age group are actualtly enrolled in school withdying<br />
by age 5 than male babies, but the risk of out the numbers being inflated by over- or underdying<br />
by age 5 is actually higher for females than age children.<br />
for males in some lower-income economies. This The primary pupil-tacer ratio is the number of<br />
pattern is not uniformly associated with develop pupils enrolled in school in a country divided by the<br />
ment. There are low- and middle-income countries number of teachers in the education system.<br />
(and regions within countries) where for example, The summary measures in this table are country<br />
the risk of dying by age 5 for females relative to enrollment rates weighted by each country's share<br />
males approximates the pattern found in industrial in the aggregate population.<br />
countries.<br />
The summary measures in this table are country Table 29. Gender comparsons<br />
data weighted by the relevant population subgroup. This table provides selected basic indicators disag-<br />
Table-28. Education<br />
gregated to show differences between the sexes that<br />
illustrate the condition of women in society. The<br />
The data in this table refer to a variety of years, gen- measures reflect the demographic status of women<br />
eraly not more than two years distant from those and their access to health and education servicesspecified.<br />
Figures for females, however, sometimes Statistical anomalies become even more apparent<br />
,: i.; - - . ~~~~~~~~~~~~~~~~~~~~~~~~4


