- Page 1 and 2:
Applied Biosystems7900HT Fast Real-
- Page 3 and 4:
ContentsPrefaceHow to Use This Guid
- Page 5 and 6:
Chapter 4Operating the InstrumentNo
- Page 7 and 8:
Chapter 7Maintaining the Instrument
- Page 9 and 10:
Appendix D Theory of OperationFluor
- Page 11 and 12:
PrefaceHow to Use This GuidePurpose
- Page 13 and 14:
Safety and EMC Compliance Informati
- Page 15 and 16:
Symbols on InstrumentsSymbols on In
- Page 17 and 18:
General Instrument SafetyGeneral In
- Page 19 and 20:
Chemical Waste SafetyChemical Safet
- Page 21 and 22:
Physical Hazard SafetyOvervoltageRa
- Page 23 and 24:
Workstation SafetyWorkstation Safet
- Page 25 and 26:
Product Overview 11In This Chapter
- Page 27 and 28:
7900HT FAST Real-Time PCR SystemSec
- Page 29 and 30:
7900HT InstrumentInterchangeableThe
- Page 31 and 32:
7900HT FAST Real-Time PCR SystemBar
- Page 33 and 34:
Compatible ConsumablesCompatible Co
- Page 35 and 36:
Instrument ConnectionsFixed-Positio
- Page 37 and 38:
Section 1.2 Getting to Know the Sof
- Page 39 and 40:
SDS Software Related Files and Form
- Page 41 and 42:
7900HT FAST Real-Time PCR SystemMan
- Page 43 and 44:
Esc F1 F2 F3 F4 F5 F6 F7 F8 F9 F10
- Page 45 and 46:
Section 1.3 SDS Enterprise Database
- Page 47 and 48:
* + Enter* +Enter3Down UpNumLockSys
- Page 49 and 50:
About the SDS Enterprise Database S
- Page 51 and 52:
Esc F1 F2 F3 F4 F5 F6 F7 F8 F9 F10
- Page 53 and 54:
Getting Started 22In This Chapter G
- Page 55 and 56:
Getting StartedUsing the SDSSoftwar
- Page 57 and 58:
GR23967900HTPowering On the 7900HT
- Page 59 and 60:
Using the SDS SoftwareUsing the SDS
- Page 61 and 62:
Using the SDS SoftwareAbout theMess
- Page 63 and 64:
Basic Software Skills TutorialNotes
- Page 65 and 66:
Basic Software Skills TutorialExerc
- Page 67 and 68:
Basic Software Skills TutorialExpor
- Page 69 and 70:
Basic Software Skills TutorialExerc
- Page 71 and 72:
Basic Software Skills TutorialExerc
- Page 73 and 74:
Basic Software Skills TutorialLesso
- Page 75 and 76:
Basic Software Skills TutorialLesso
- Page 77 and 78:
Basic Software Skills Tutorial3. Se
- Page 79 and 80:
Basic Software Skills TutorialLesso
- Page 81 and 82:
Using SDS Plate DocumentsUsing SDS
- Page 83 and 84:
Using SDS Plate DocumentsWell Inspe
- Page 85 and 86:
Preparing a Run 33In This Chapter N
- Page 87 and 88:
Notes for Database UsersDescription
- Page 89 and 90:
Workflow OverviewWorkflow OverviewE
- Page 91 and 92:
Workflow OverviewAllelicDiscriminat
- Page 93 and 94:
Step 1 - Creating a Plate DocumentS
- Page 95 and 96:
Step 2 - Applying Detectors and Mar
- Page 97 and 98:
Step 2 - Applying Detectors and Mar
- Page 99 and 100:
Step 2 - Applying Detectors and Mar
- Page 101 and 102:
Step 3 - Configuring the Plate Docu
- Page 103 and 104:
Step 5 - Programming the Plate Docu
- Page 105 and 106:
Step 5 - Programming the Plate Docu
- Page 107 and 108:
Step 5 - Programming the Plate Docu
- Page 109 and 110:
Step 6 - Saving the Plate Document
- Page 111 and 112:
Step 7 - Creating a Plate Document
- Page 113 and 114:
Step 9 - Running the Plate on the 7
- Page 115 and 116:
Operating the Instrument 44In This
- Page 117 and 118:
Notes for Database UsersDescription
- Page 119 and 120:
Section 4.1 Consumable PreparationS
- Page 121 and 122:
Compatible ConsumablesTable 4-1Comp
- Page 123 and 124:
Preparing Optical Plates for Usea.
- Page 125 and 126:
Preparing TaqMan Low Density Arrays
- Page 127 and 128:
Preparing TaqMan Low Density Arrays
- Page 129 and 130:
Preparing TaqMan Low Density Arrays
- Page 131 and 132:
Preparing TaqMan Low Density Arrays
- Page 133 and 134:
Preparing TaqMan Low Density Arrays
- Page 135 and 136:
Preparing TaqMan Low Density Arrays
- Page 137 and 138:
Section 4.2 Running an Individual P
- Page 139 and 140:
Running a Single Plate (Using the S
- Page 141 and 142:
Running a Single Plate (Using the S
- Page 143 and 144:
After the RunAfter the RunUser Acce
- Page 145 and 146:
Section 4.3 Automated OperationSect
- Page 147 and 148:
Operating the Software with an SDS
- Page 149 and 150:
Operating the Software without an S
- Page 151 and 152:
Operating the Software without an S
- Page 153 and 154:
Operating the Software without an S
- Page 155 and 156:
Running Plates Using the Automation
- Page 157 and 158:
Running Plates Using the Automation
- Page 159 and 160:
Analyzing End-Point Data 55In This
- Page 161 and 162:
Notes for Database UsersNotes for D
- Page 163 and 164:
Section 5.1 Allelic DiscriminationS
- Page 165 and 166:
OverviewTable 5-1Signal and Sequenc
- Page 167 and 168:
Before You BeginBefore You BeginUsi
- Page 169 and 170:
Opening the Run DataOpening the Run
- Page 171 and 172:
Calling and Scrutinizing Allelic Di
- Page 173 and 174:
Calling and Scrutinizing Allelic Di
- Page 175 and 176:
Calling and Scrutinizing Allelic Di
- Page 177 and 178:
After the AnalysisSaving theResults
- Page 179 and 180:
Analyzing Real-Time Data 66In This
- Page 181 and 182:
Notes for Database UsersDescription
- Page 183 and 184:
Section 6.1 Absolute Quantification
- Page 185 and 186:
OverviewAlgorithmicManipulation ofR
- Page 187 and 188:
Analysis ChecklistAnalysis Checklis
- Page 189 and 190:
Analyzing the DataAnalyzing the Dat
- Page 191 and 192:
Viewing ResultsViewing ResultsViewi
- Page 193 and 194:
Section 6.2 Relative Quantification
- Page 195 and 196:
OverviewAlgorithmic Manipulation of
- Page 197 and 198:
OverviewAutomatic Outlier RemovalAb
- Page 199 and 200:
Getting StartedGetting StartedUsing
- Page 201 and 202:
Options for Analyzing Relative Quan
- Page 203 and 204:
Creating the Studyd. In the Plate Q
- Page 205 and 206:
Analyzing the Study• Manual Ct -
- Page 207 and 208:
Analyzing the StudySpecifying the A
- Page 209 and 210:
Viewing ResultsViewing ResultsDispl
- Page 211 and 212:
Viewing ResultsAbout DownArrowsDown
- Page 213 and 214:
After the AnalysisAfter the Analysi
- Page 215 and 216:
Section 6.3 Dissociation Curve Anal
- Page 217 and 218:
Before You BeginExample ResultsFigu
- Page 219 and 220:
Opening the Run DataOpening the Run
- Page 221 and 222:
Determining T m Values for the Anal
- Page 223 and 224:
Section 6.4 Procedure ReferenceSect
- Page 225 and 226:
Setting the Baseline and Threshold
- Page 227 and 228:
Eliminating Outlying AmplificationE
- Page 229 and 230:
Eliminating Outlying Amplification6
- Page 231 and 232:
After the AnalysisSaving theResults
- Page 233 and 234:
Maintaining the Instrument 77In Thi
- Page 235 and 236:
Notes for Database UsersDescription
- Page 237 and 238:
Section 7.1 Maintaining the 7900HT
- Page 239 and 240:
Replacing the Sample BlockMaterials
- Page 241 and 242:
Replacing the Sample Block9. Loosen
- Page 243 and 244:
7900HT FAST Real-Time PCR SystemRep
- Page 245 and 246:
Changing the Plate Adapter4. Place
- Page 247 and 248:
Decontaminating the Sample BlockCle
- Page 249 and 250:
Performing a Background RunPreparin
- Page 251 and 252:
Performing a Background RunAnalyzin
- Page 253 and 254:
Performing a Pure Dye RunAfter a ru
- Page 255 and 256:
Performing a Pure Dye Run• Fast 9
- Page 257 and 258:
Performing a Pure Dye RunAnalyzing
- Page 259 and 260:
Adding Custom Dyes to the Pure Dye
- Page 261 and 262:
Adding Custom Dyes to the Pure Dye
- Page 263 and 264:
Verifying Instrument PerformanceTab
- Page 265 and 266:
Verifying Instrument PerformancePre
- Page 267 and 268:
Section 7.2 Maintaining the Plate H
- Page 269 and 270:
Adjusting the Sensitivity of the Pl
- Page 271 and 272:
Adjusting the Sensitivity of the Pl
- Page 273 and 274:
7900HT FAST Real-Time PCR SystemAli
- Page 275 and 276:
Aligning the Plate Handler5. Using
- Page 277 and 278:
Aligning the Plate Handler7. Using
- Page 279 and 280:
Aligning the Plate Handler13. Click
- Page 281 and 282:
7900HT FAST Real-Time PCR SystemAli
- Page 283 and 284:
Aligning the Fixed-Position Bar Cod
- Page 285 and 286:
Section 7.3 Maintaining the Compute
- Page 287 and 288:
Maintaining the SDS softwareSeveral
- Page 289 and 290:
Troubleshooting 88In This Chapter T
- Page 291 and 292:
Troubleshooting TableTable 8-1Troub
- Page 293 and 294:
Low Precision or IrreproducibilityL
- Page 295 and 296:
Low Precision or IrreproducibilityD
- Page 297 and 298:
Background RunsBackground RunsBackg
- Page 299 and 300:
Pure Dye Runs6. Repeat step 4 until
- Page 301 and 302: End-Point Runs (Allelic Discriminat
- Page 303 and 304: Software and 7900HT InstrumentTable
- Page 305 and 306: Zymark Twister Microplate Handler a
- Page 307 and 308: TaqMan Low Density ArrayTable 8-6Tr
- Page 309 and 310: Software ReferenceAAIn This Appendi
- Page 311 and 312: Importing Plate Document Setup Tabl
- Page 313 and 314: Setup Table Files1. File VersionDes
- Page 315 and 316: Setup Table Files6. Detectors ListD
- Page 317 and 318: Setup Table Files9. Markers List (A
- Page 319 and 320: Setup Table FilesFormat(for a singl
- Page 321 and 322: Setup Table FilesFormat(for a singl
- Page 323 and 324: Setup Table FilesExample Code A-16A
- Page 325 and 326: Exporting Plate Document Data4. In
- Page 327 and 328: Operating the SDS Software from a C
- Page 329 and 330: Using the Search ToolLogical Operat
- Page 331 and 332: Connecting SDS Software to the Data
- Page 333 and 334: Designing TaqMan Reagent-BasedAssay
- Page 335 and 336: Assay Development Guidelines• For
- Page 337 and 338: Design Tips for Allelic Discriminat
- Page 339 and 340: Kits, Reagents, and ConsumablesCCIn
- Page 341 and 342: Consumables and DisposablesConsumab
- Page 343 and 344: Instrument Maintenance and Verifica
- Page 345 and 346: Custom Oligonucleotide SynthesisTab
- Page 347 and 348: Theory of OperationDDIn This Append
- Page 349 and 350: Fluorescent-Based ChemistriesBasics
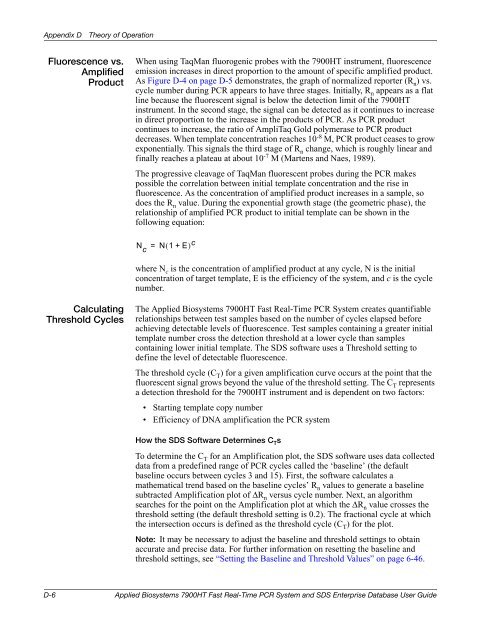
- Page 351: Real-Time Data AnalysisPhase 2: Lin
- Page 355 and 356: A similar equation for the endogeno
- Page 357 and 358: Limited Warranty StatementEEWarrant
- Page 359 and 360: BibliographyGeneral Paperson TaqMan
- Page 361 and 362: Klein, D., Janda, P., Steinborn, R.
- Page 363 and 364: Dolken, L., F. , Schuler, and G. ,
- Page 365 and 366: AllelicDiscriminationVirtanen M., H
- Page 367 and 368: Glossary.sdd.sdm.sds.sdt∆C T∆
- Page 369 and 370: ackgroundbaselinecalibratorcDNA(com
- Page 371 and 372: minor groovebinder (MGB)multicompon
- Page 373 and 374: R nrunsessionsingle nucleotidepolym
- Page 375 and 376: IndexSymbols- 6-31↑ 6-33Numerics7
- Page 377 and 378: fluorescent, common sources 8-7isol
- Page 379 and 380: adjusting step parameters 3-21confi
- Page 381 and 382: sample block locking bar 7-8sample
- Page 384: Worldwide Sales and SupportApplied


