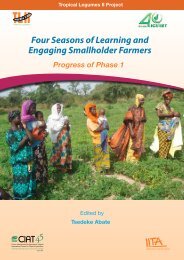
Four Seasons of Learning and Engaging Smallholder Farmers - icrisat
Four Seasons of Learning and Engaging Smallholder Farmers - icrisat
Four Seasons of Learning and Engaging Smallholder Farmers - icrisat
Create successful ePaper yourself
Turn your PDF publications into a flip-book with our unique Google optimized e-Paper software.
The consequences are that the improved varieties failing to reach the intended users at the time they are<br />
needed or high seed prices. Therefore, government interventions to support the initial seed production<br />
<strong>and</strong> distribution will be required at least in the short- to medium-term. The role <strong>of</strong> community level<br />
risk management schemes like crop insurance schemes also need to be studied <strong>and</strong> integrated in the<br />
interventions if found effective to reduce risk as a long-term strategy to encourage the growth <strong>of</strong> the<br />
private sector in input markets.<br />
Table 6-1: Average weighted rank <strong>of</strong> the bean production constraints in Eastern Kenya <strong>and</strong> Ethiopia<br />
Constraint Eastern Kenya Ethiopia<br />
Central Rift Valley<br />
SNNPR<br />
Drought 4.83 5.43 4.18<br />
Pests <strong>and</strong> diseases 4.07 4.27 3.85<br />
Poor access to good quality seed 4.17 4.66 3.64<br />
Low availability <strong>of</strong> good quality seed 2.17 2.47 1.85<br />
High price <strong>of</strong> good quality seed 2.00 2.19 1.79<br />
Lack <strong>of</strong> high yielding seed varieties 2.48 3.18 1.70<br />
L<strong>and</strong>-related issues<br />
declined l<strong>and</strong> sizes 3.51 3.04 4.03<br />
Poor soil fertility 1.66 1.74 1.58<br />
Labour-related problems 3.55 6.0 0.84<br />
Shortage <strong>of</strong> labour 1.44 2.40 0.38<br />
Labour intensive crop 0.63 1.17 0.03<br />
High cost <strong>of</strong> labour 1.48 2.43 0.43<br />
Others<br />
Lack <strong>of</strong> markets 1.45 2.22 0.61<br />
Lack <strong>of</strong> good storage facilities 0.90 1.27 0.49<br />
Lack <strong>of</strong> information 0.73 1.25 0.15<br />
NB: The weighted average rank was found by multiplying each rank attached in decreasing order <strong>of</strong> importance by its weight corresponding<br />
to the importance. Weights were assigned to each rank in a descending order starting with 12 <strong>and</strong> ending with 1.<br />
Table 6-2: Average total l<strong>and</strong> size, utilization <strong>and</strong> contribution <strong>of</strong> non- farm income in eastern Kenya <strong>and</strong><br />
Ethiopia<br />
Parameter<br />
Eastern Kenya<br />
(N=64)<br />
Central Rift Valley*<br />
(N=115)<br />
SNNPR*<br />
(N=105)<br />
Average L<strong>and</strong>holding (ha) 1.680 2.680 1.700<br />
Area allocated to the crops in a year<br />
Cropped area (ha) 1.140 2.510 1.620<br />
Bean area (ha) 0.330 0.874 0.338<br />
Crop area occupied by common bean (%) 28.900 34.870 22.320<br />
% contribution <strong>of</strong> non-farm income to household cash income<br />
Petty trade 18.390 4.890 9.600<br />
Formal <strong>of</strong>f-farm employment 36.090 2.350 3.100<br />
Remittances 17.470 - -<br />
*Data for only meher (main, long-rain) season was used for Ethiopian sample because common bean is rarely cultivated in the belg (shortrain)<br />
season<br />
116<br />
<strong>Engaging</strong> <strong>Smallholder</strong> <strong>Farmers</strong> | Tropical Legumes II Project


