Download - Academy Publisher
Download - Academy Publisher
Download - Academy Publisher
You also want an ePaper? Increase the reach of your titles
YUMPU automatically turns print PDFs into web optimized ePapers that Google loves.
egression. Granger causality test is useful to determine<br />
whether one time series can be used to forecast another.<br />
Here we can use Granger causality test to find the guiding<br />
market in the markets.<br />
Then use cross spectrum analysis to find the exactly<br />
relationship between futures price fluctuation, get the lag<br />
coefficient and make price prediction for the following<br />
market.<br />
Basic idea of Spectrum analysis and cross spectrum<br />
analysis is that time series are considered as the<br />
superposition of sine and cosine waves. Fluctuation<br />
pattern of time series can be revealed by comparing<br />
variances and circles of the waves.<br />
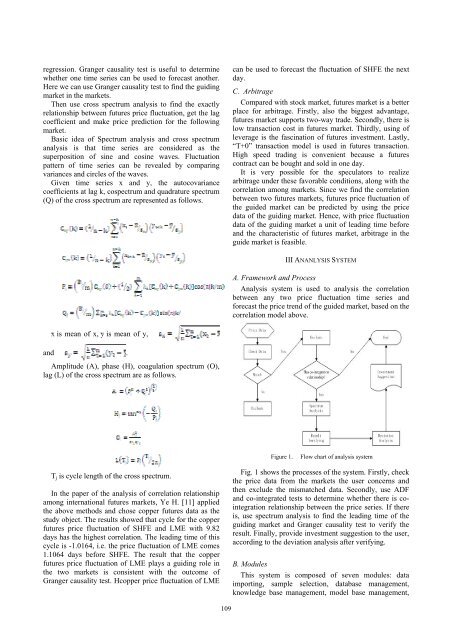
Given time series x and y, the autocovariance<br />
coefficients at lag k, cospectrum and quadrature spectrum<br />
(Q) of the cross spectrum are represented as follows.<br />
can be used to forecast the fluctuation of SHFE the next<br />
day.<br />
C. Arbitrage<br />
Compared with stock market, futures market is a better<br />
place for arbitrage. Firstly, also the biggest advantage,<br />
futures market supports two-way trade. Secondly, there is<br />
low transaction cost in futures market. Thirdly, using of<br />
leverage is the fascination of futures investment. Lastly,<br />
“T+0” transaction model is used in futures transaction.<br />
High speed trading is convenient because a futures<br />
contract can be bought and sold in one day.<br />
It is very possible for the speculators to realize<br />
arbitrage under these favorable conditions, along with the<br />
correlation among markets. Since we find the correlation<br />
between two futures markets, futures price fluctuation of<br />
the guided market can be predicted by using the price<br />
data of the guiding market. Hence, with price fluctuation<br />
data of the guiding market a unit of leading time before<br />
and the characteristic of futures market, arbitrage in the<br />
guide market is feasible.<br />
III ANANLYSIS SYSTEM<br />
A. Framework and Process<br />
Analysis system is used to analysis the correlation<br />
between any two price fluctuation time series and<br />
forecast the price trend of the guided market, based on the<br />
correlation model above.<br />
x¯ is mean of x, ȳ is mean of y,<br />
and .<br />
Amplitude (A), phase (H), coagulation spectrum (O),<br />
lag (L) of the cross spectrum are as follows.<br />
Figure 1.<br />
Flow chart of analysis system<br />
T j is cycle length of the cross spectrum.<br />
In the paper of the analysis of correlation relationship<br />
among international futures markets, Ye H. [11] applied<br />
the above methods and chose copper futures data as the<br />
study object. The results showed that cycle for the copper<br />
futures price fluctuation of SHFE and LME with 9.82<br />
days has the highest correlation. The leading time of this<br />
cycle is -1.0164, i.e. the price fluctuation of LME comes<br />
1.1064 days before SHFE. The result that the copper<br />
futures price fluctuation of LME plays a guiding role in<br />
the two markets is consistent with the outcome of<br />
Granger causality test. Hcopper price fluctuation of LME<br />
Fig. 1 shows the processes of the system. Firstly, check<br />
the price data from the markets the user concerns and<br />
then exclude the mismatched data. Secondly, use ADF<br />
and co-integrated tests to determine whether there is cointegration<br />
relationship between the price series. If there<br />
is, use spectrum analysis to find the leading time of the<br />
guiding market and Granger causality test to verify the<br />
result. Finally, provide investment suggestion to the user,<br />
according to the deviation analysis after verifying.<br />
B. Modules<br />
This system is composed of seven modules: data<br />
importing, sample selection, database management,<br />
knowledge base management, model base management,<br />
109


