

Download - Academy Publisher
Download - Academy Publisher
Download - Academy Publisher

Create successful ePaper yourself
Turn your PDF publications into a flip-book with our unique Google optimized e-Paper software.
Further<br />
so<br />
⎛ σ (1) ⎞<br />
1 > ⎜ ⎟<br />
⎝ σ ( n)<br />
⎠<br />
1<br />
more<br />
⎛ σ (1) ⎞<br />
> ⎜ ⎟<br />
⎝ σ ( n)<br />
⎠<br />
2<br />
⎛ σ (1) ⎞<br />
> ⎜ ⎟<br />
⎝ σ ( n)<br />
⎠<br />
3<br />
σ (1)<br />
,<br />
0 < < 1<br />
σ ( n)<br />
> ....... > 0<br />
, namely<br />
~<br />
σ<br />
would be more close to 1 if the value of t becomes<br />
bigger.<br />
2) When {()} x k is monotone decreasing about k ,<br />
then the class ratio of each point x(<br />
k − 1) ,<br />
and letσ<br />
( 1) = max{ σ ( k )} ≥ 1 , then,<br />
σ ( k ) = ≥ 1<br />
x(<br />
k )<br />
~<br />
t<br />
t<br />
σ ( n)<br />
− σ (1)<br />
⎛ σ ( n)<br />
n n<br />
n n<br />
t<br />
⎟ ⎞<br />
σ = σ ( ) + (1 − σ ( ))<br />
= σ ( ) + (1 − σ ( )) 1 −<br />
⎜<br />
σ (1)<br />
⎝ σ (1) ⎠<br />
Further more<br />
σ ( n ) ,<br />
0 < < 1 σ (1)<br />
so<br />
1<br />
⎛ σ ( n ) ⎞<br />
1 > ⎜ ⎟<br />
⎝ σ (1) ⎠<br />
2<br />
⎛ σ ( n)<br />
⎞<br />
> ⎜ ⎟<br />
⎝ σ (1) ⎠<br />
3<br />
⎛ σ ( n)<br />
⎞<br />
> ⎜ ⎟<br />
⎝ σ (1) ⎠<br />
> ....... > 0<br />
t<br />
.<br />
, namely<br />
~<br />
σ<br />
would be more close to 1 if the value of t becomes<br />
bigger.<br />
End.<br />
IV. EXAMPLE ANALYSIS<br />
Take the data which is the industrial total output value of<br />
a certain city in reference [6] as an example. Select the<br />
industrial total output value of a certain city in 1997-<br />
2004 as the primary<br />
data,X=(187.85,303.79,394.13,498.27,580.43,640.21,702<br />
.34,708.86)(Unit: Hundred million Yuan). Take the data<br />
of 1997-2003 as the modeling data, and the data of 2004<br />
as the inspection data.From the primary data, we can find<br />
that the average annual growth rate of the industrial total<br />
output value is 26.06% in 1997-2003years. Generally<br />
speaking that it is impossible to maintain such growth<br />
rate for a long time. So if we forecast with this data, the<br />
result is difficult to believe. Through analyzing this<br />
situation, we can find that because nation has given this<br />
city some special industrial policies, thus the industry of<br />
this city to obtain a very good development turning point.<br />
But after 20 years, when the city's industry strength is<br />
quite strong, the country will cancel the special policy.<br />
So from now on, it is already impossible to maintain the<br />
development speed as the same as before. In order to<br />
make a reasonable forecast to development trend of this<br />
city's industrial total output value, we can use weakening<br />
buffer operator to eliminate the disturbance from the<br />
special industrial policies on the later period industry<br />
economy system development speed, and then enhance<br />
the forecast precision of mode. In addition, we can<br />
establish model on original sequence directly by<br />
weakening class ratio modeling method.<br />
Let us obtain model GM (1, 1) by weakening class ratio<br />
modeling method and obtain model GM (1, 1) by using<br />
the weakening buffer operator in reference [4] to<br />
preprocess original data at first before establish model<br />
GM (1, 1) respectively .<br />
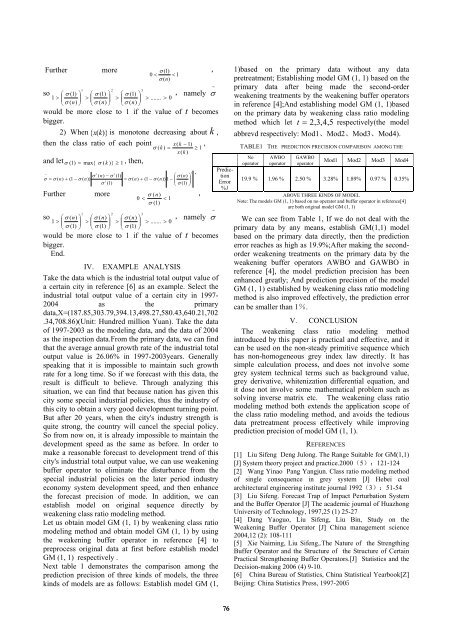
Next table 1 demonstrates the comparison among the<br />
prediction precision of three kinds of models, the three<br />
kinds of models are as follows: Establish model GM (1,<br />
Prediction<br />
Error<br />
%1<br />
1)based on the primary data without any data<br />
pretreatment; Establishing model GM (1, 1) based on the<br />
primary data after being made the second-order<br />
weakening treatments by the weakening buffer operators<br />
in reference [4];And establishing model GM (1, 1)based<br />
on the primary data by weakening class ratio modeling<br />
method which let t = 2,3,4, 5 respectively(the model<br />
abbrevd respectively: Mod1、Mod2、Mod3、Mod4).<br />
TABLE1 THE PREDICTION PRECISION COMPARISON AMONG THE<br />
No<br />
operator<br />
AWBO<br />
operator<br />
GAWBO<br />
operator<br />
Mod1 Mod2 Mod3 Mod4<br />
19.9 % 1.96 % 2.50 % 3.28% 1.89% 0.97 % 0.35%<br />
ABOVE THREE KINDS OF MODEL<br />
Note: The models GM (1, 1) based on no operator and buffer operator in reference[4]<br />
are both original model GM (1, 1)<br />
We can see from Table 1, If we do not deal with the<br />
primary data by any means, establish GM(1,1) model<br />
based on the primary data directly, then the prediction<br />
error reaches as high as 19.9%;After making the secondorder<br />
weakening treatments on the primary data by the<br />
weakening buffer operators AWBO and GAWBO in<br />
reference [4], the model prediction precision has been<br />
enhanced greatly; And prediction precision of the model<br />
GM (1, 1) established by weakening class ratio modeling<br />
method is also improved effectively, the prediction error<br />
can be smaller than 1%.<br />
V. CONCLUSION<br />
The weakening class ratio modeling method<br />
introduced by this paper is practical and effective, and it<br />
can be used on the non-steady primitive sequence which<br />
has non-homogeneous grey index law directly. It has<br />
simple calculation process, and does not involve some<br />
grey system technical terms such as background value,<br />
grey derivative, whitenization differential equation, and<br />
it dose not involve some mathematical problem such as<br />
solving inverse matrix etc. The weakening class ratio<br />
modeling method both extends the application scope of<br />
the class ratio modeling method, and avoids the tedious<br />
data pretreatment process effectively while improving<br />
prediction precision of model GM (1, 1).<br />
REFERENCES<br />
[1] Liu Sifeng Deng Julong. The Range Suitable for GM(1,1)<br />
[J] System theory project and practice.2000(5):121-124<br />
[2] Wang Yinao Pang Yangjun. Class ratio modeling method<br />
of single consequence in grey system [J] Hebei coal<br />
architectural engineering institute journal 1992(3):51-54<br />
[3] Liu Sifeng. Forecast Trap of Impact Perturbation System<br />
and the Buffer Operator [J] The academic journal of Huazhong<br />
University of Technology, 1997,25 (1) 25-27<br />
[4] Dang Yaoguo, Liu Sifeng, Liu Bin, Study on the<br />
Weakening Buffer Operator [J] China management science<br />
2004,12 (2): 108-111<br />
[5] Xie Naiming, Liu Sifeng,.The Nature of the Strengthing<br />
Buffer Operator and the Structure of the Structure of Certain<br />
Practical Strengthening Buffer Operators.[J] Statistics and the<br />
Decision-making 2006 (4) 9-10.<br />
[6] China Bureau of Statistics, China Statistical Yearbook[Z]<br />
Beijing: China Statistics Press, 1997-2005<br />
76


