

Download - Academy Publisher
Download - Academy Publisher
Download - Academy Publisher

Create successful ePaper yourself
Turn your PDF publications into a flip-book with our unique Google optimized e-Paper software.
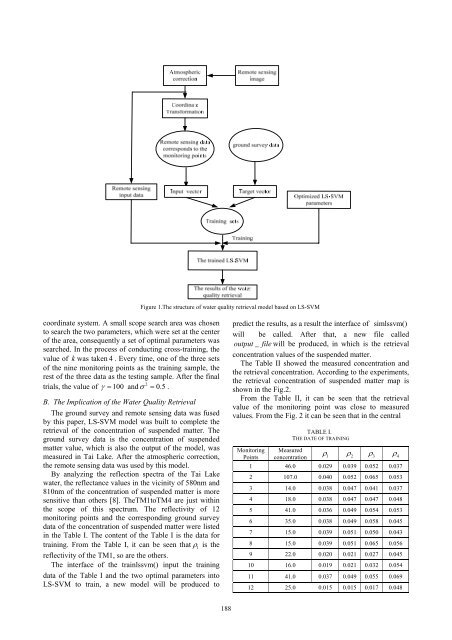
Figure 1.The structure of water quality retrieval model based on LS-SVM<br />
coordinate system. A small scope search area was chosen<br />
to search the two parameters, which were set at the center<br />
of the area, consequently a set of optimal parameters was<br />
searched. In the process of conducting cross-training, the<br />
value of k was taken 4 . Every time, one of the three sets<br />
of the nine monitoring points as the training sample, the<br />
rest of the three data as the testing sample. After the final<br />
trials, the value of γ = 100 andσ 2 = 0.5 .<br />
B. The Implication of the Water Quality Retrieval<br />
The ground survey and remote sensing data was fused<br />
by this paper, LS-SVM model was built to complete the<br />
retrieval of the concentration of suspended matter. The<br />
ground survey data is the concentration of suspended<br />
matter value, which is also the output of the model, was<br />
measured in Tai Lake. After the atmospheric correction,<br />
the remote sensing data was used by this model.<br />
By analyzing the reflection spectra of the Tai Lake<br />
water, the reflectance values in the vicinity of 580nm and<br />
810nm of the concentration of suspended matter is more<br />
sensitive than others [8]. TheTM1toTM4 are just within<br />
the scope of this spectrum. The reflectivity of 12<br />
monitoring points and the corresponding ground survey<br />
data of the concentration of suspended matter were listed<br />
in the Table I. The content of the Table I is the data for<br />
training. From the Table I, it can be seen that ρ<br />
1<br />
is the<br />
reflectivity of the TM1, so are the others.<br />
The interface of the trainlssvm() input the training<br />
data of the Table I and the two optimal parameters into<br />
LS-SVM to train, a new model will be produced to<br />
predict the results, as a result the interface of simlssvm()<br />
will be called. After that, a new file called<br />
output _ file will be produced, in which is the retrieval<br />
concentration values of the suspended matter.<br />
The Table II showed the measured concentration and<br />
the retrieval concentration. According to the experiments,<br />
the retrieval concentration of suspended matter map is<br />
shown in the Fig.2.<br />
From the Table II, it can be seen that the retrieval<br />
value of the monitoring point was close to measured<br />
values. From the Fig. 2 it can be seen that in the central<br />
Monitoring<br />
Points<br />
TABLE I.<br />
THE DATE OF TRAINING<br />
Measured<br />
ρ<br />
concentration 1<br />
ρ<br />
2<br />
ρ3<br />
ρ<br />
4<br />
1 46.0 0.029 0.039 0.052 0.037<br />
2 107.0 0.040 0.052 0.065 0.053<br />
3 14.0 0.038 0.047 0.041 0.037<br />
4 18.0 0.038 0.047 0.047 0.048<br />
5 41.0 0.036 0.049 0.054 0.053<br />
6 35.0 0.038 0.049 0.058 0.045<br />
7 15.0 0.039 0.051 0.050 0.043<br />
8 15.0 0.039 0.051 0.065 0.056<br />
9 22.0 0.020 0.021 0.027 0.045<br />
10 16.0 0.019 0.021 0.032 0.054<br />
11 41.0 0.037 0.049 0.055 0.069<br />
12 25.0 0.015 0.015 0.017 0.048<br />
188


