

Download - Academy Publisher
Download - Academy Publisher
Download - Academy Publisher

You also want an ePaper? Increase the reach of your titles
YUMPU automatically turns print PDFs into web optimized ePapers that Google loves.
influence of emotion on the activity of the nervous<br />
system is effectively reflected in the physiological signals<br />
employed. Unlike the case of speech recognition or facial<br />
expression recognition, where knowledge of the correct<br />
class label of a given data point is self-evident, the<br />
acquisition of a high-quality physiological signal<br />
database with confidence in the underlying emotional<br />
status is an intricate task.<br />
The physiological signal data of ECG is from the<br />
MIT-BIH, Standard MIT-BIH Arrhythmia database are<br />
collected by Beth Israel Hospital Arrhythmia Laboratory<br />
from 1975 to 1979. There are more than 4000 data Holtel<br />
sets [6]. Database has a total of 48 records, which are from<br />
47 individuals (of which 201 and 202 are from the same<br />
individual).<br />
In MIT-BIH database, each record contains data on<br />
two channels, which leads settings as follows: The first<br />
channel is the use of calibration limb leads Ⅱ; The second<br />
channel used correction V1 (occasionally have V2, V5<br />
leads, there is another V4 leads). Data’s sampling<br />
frequency is 360HZ and the sampling accuracy is 11 bits<br />
(sample data range between 0 ~ 2047).<br />
analysis figure, and this paper extracts the maximum<br />
value as the feature vector of different pattern of ECG.<br />
Wavelet Transform analyzed ECG parameters are<br />
statistically classified as emotional pattern joy, anger,<br />
sadness and pleasure. These parameters are then applied to<br />
ANN as training and testing data. Also, these parameters<br />
are considered as neurons in ANN. The neurons in a<br />
feedforward neural network are organized as a layered<br />
structure and connected in a strictly feedforward manner.<br />
The structure of a basic feedforward neural network is<br />
presented in Fig.1. The feedforward neural network is one<br />
of the most widely used ANNs. A great number of<br />
successful applications of this type of network have been<br />
reported [7].<br />
So, after the four-scale decomposition procedure, we<br />
get wavelet coefficients of maximum value value of a<br />
typical ECG pattern. There are only four representative<br />
samples given. Each ECG classification pattern signal is<br />
composed by five coefficients. Then decompose the fourscale<br />
wavelet to get the 5-dimensional feature vector as<br />
the input feature vector of ECG for pattern recognition<br />
with method of BP neural network.<br />
Beacuse each line has only one element of each<br />
column (under the painted lines are) which is much larger<br />
than other elements, which indicates that separation<br />
algorithm is very satisfactory.<br />
For describing the separation effect quantitatively, we<br />
n<br />
1 si<br />
− yi<br />
2<br />
∑<br />
MN s<br />
i=<br />
1 i 2<br />
use the expression<br />
to compute the<br />
average relative error of the source signals and separated<br />
signals, where N is the number of the source, M is the<br />
sampling points). The error curve is showed in Figure 4.<br />
We can know the system has large error when starting the<br />
train but the error slowly getting smaller and smaller, soon<br />
met the desired error and the convergence effect is also<br />
obvious in Figure 4.<br />
18<br />
16<br />
14<br />
12<br />
10<br />
8<br />
6<br />
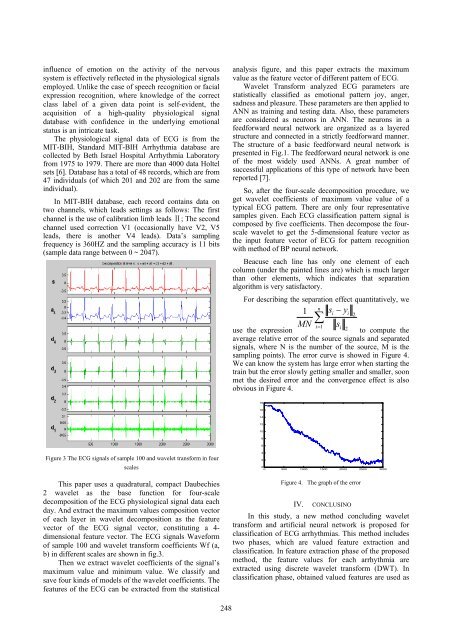
Figure 3 The ECG signals of sample 100 and wavelet transform in four<br />
scales<br />
This paper uses a quadratural, compact Daubechies<br />
2 wavelet as the base function for four-scale<br />
decomposition of the ECG physiological signal data each<br />
day. And extract the maximum values composition vector<br />
of each layer in wavelet decomposition as the feature<br />
vector of the ECG signal vector, constituting a 4-<br />
dimensional feature vector. The ECG signals Waveform<br />
of sample 100 and wavelet transform coefficients Wf (a,<br />
b) in different scales are shown in fig.3.<br />
Then we extract wavelet coefficients of the signal’s<br />
maximum value and minimum value. We classify and<br />
save four kinds of models of the wavelet coefficients. The<br />
features of the ECG can be extracted from the statistical<br />
4<br />
2<br />
0<br />
0 500 1000 1500 2000 2500 3000<br />
Figure 4. The graph of the error<br />
IV. CONCLUSINO<br />
In this study, a new method concluding wavelet<br />
transform and artificial neural network is proposed for<br />
classification of ECG arrhythmias. This method includes<br />
two phases, which are valued feature extraction and<br />
classification. In feature extraction phase of the proposed<br />
method, the feature values for each arrhythmia are<br />
extracted using discrete wavelet transform (DWT). In<br />
classification phase, obtained valued features are used as<br />
248


