

Download - Academy Publisher
Download - Academy Publisher
Download - Academy Publisher

Create successful ePaper yourself
Turn your PDF publications into a flip-book with our unique Google optimized e-Paper software.
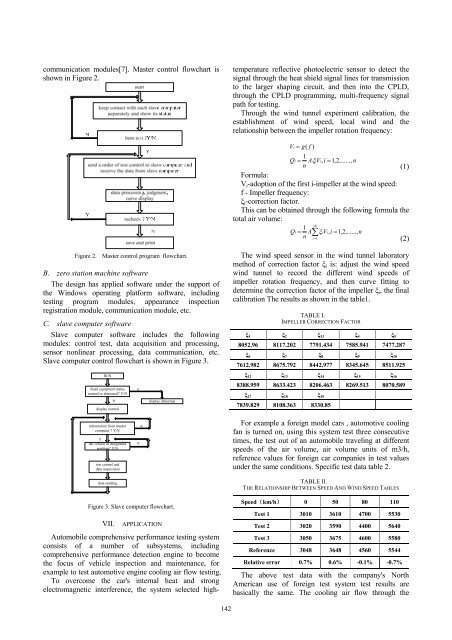
communication modules[7]. Master control flowchart is<br />
shown in Figure 2.<br />
Automobile comprehensive performance testing system<br />
consists of a number of subsystems, including<br />
comprehensive performance detection engine to become<br />
the focus of vehicle inspection and maintenance, for<br />
example to test automotive engine cooling air flow testing,<br />
To overcome the car's internal heat and strong<br />
electromagnetic interference, the system selected hightemperature<br />
reflective photoelectric sensor to detect the<br />
signal through the heat shield signal lines for transmission<br />
to the larger shaping circuit, and then into the CPLD,<br />
through the CPLD programming, multi-frequency signal<br />
path for testing.<br />
Through the wind tunnel experiment calibration, the<br />
establishment of wind speed, local wind and the<br />
relationship between the impeller rotation frequency:<br />
Vi<br />
= g(<br />
f )<br />
1<br />
Qi<br />
= AξiVi,<br />
i = 1,2,......, n<br />
n<br />
(1)<br />
Formula:<br />
V i -adoption of the first i-impeller at the wind speed:<br />
f - Impeller frequency:<br />
ξ i -correction factor.<br />
This can be obtained through the following formula the<br />
total air volume:<br />
18<br />
1<br />
Qi = A∑ξ<br />
iVi,<br />
i = 1,2,......,<br />
n<br />
n i=<br />
1<br />
(2)<br />
Figure 2. Master control program flowchart.<br />
B. zero station machine software<br />
The design has applied software under the support of<br />
the Windows operating platform software, including<br />
testing program modules, appearance inspection<br />
registration module, communication module, etc.<br />
C. slave computer software<br />
Slave computer software includes the following<br />
modules: control test, data acquisition and processing,<br />
sensor nonlinear processing, data communication, etc.<br />
Slave computer control flowchart is shown in Figure 3.<br />
The wind speed sensor in the wind tunnel laboratory<br />
method of correction factor ξ i is: adjust the wind speed<br />
wind tunnel to record the different wind speeds of<br />
impeller rotation frequency, and then curve fitting to<br />
determine the correction factor of the impeller ξ i , the final<br />
calibration The results as shown in the table1.<br />
TABLE I.<br />
IMPELLER CORRECTION FACTOR<br />
ξ 1 ξ 2 ξ 13 ξ 4 ξ 5<br />
8052.96 8117.202 7791.434 7585.941 7477.287<br />
ξ 6 ξ 7 ξ 8 ξ 9 ξ 10<br />
7612.982 8675.792 8442.977 8345.645 8511.925<br />
RUN<br />
ξ 12 ξ 13 ξ 14 ξ 15 ξ 16<br />
Read equipment status<br />
normal or abnormal Y/N<br />
N<br />
display normal<br />
Y<br />
display abnormal<br />
8388.959 8633.423 8206.463 8269.513 8070.589<br />
ξ 17 ξ 18 ξ 19<br />
7839.829 8108.363 8330.85<br />
information from master<br />
computer Y/N<br />
Y<br />
the vehicle in designated<br />
position Y/N<br />
test control and<br />
data acquisition<br />
N<br />
N<br />
For example a foreign model cars , automotive cooling<br />
fan is turned on, using this system test three consecutive<br />
times, the test out of an automobile traveling at different<br />
speeds of the air volume, air volume units of m3/h,<br />
reference values for foreign car companies in test values<br />
under the same conditions. Specific test data table 2.<br />
data sending<br />
TABLE II.<br />
THE RELATIONSHIP BETWEEN SPEED AND WIND SPEED TABLES<br />
Figure 3. Slave computer flowchart.<br />
VII. APPLICATION<br />
Speed(km/h) 0 50 80 110<br />
Test 1 3010 3610 4700 5530<br />
Test 2 3020 3590 4400 5640<br />
Test 3 3050 3675 4600 5580<br />
Reference 3048 3648 4560 5544<br />
Relative error 0.7% 0.6% -0.1% -0.7%<br />
The above test data with the company's North<br />
American use of foreign test system test results are<br />
basically the same. The cooling air flow through the<br />
142


