

Download - Academy Publisher
Download - Academy Publisher
Download - Academy Publisher

Create successful ePaper yourself
Turn your PDF publications into a flip-book with our unique Google optimized e-Paper software.
Start<br />
Read DEM<br />
∑<br />
k∈Si<br />
E<br />
i<br />
k<br />
h( i)<br />
=<br />
(4)<br />
S<br />
Y<br />
Detect nodes without flow direction<br />
and put them into the array<br />
All nodes in the array<br />
are processed<br />
N<br />
An unprocessed node in the<br />
array is put into the open list<br />
Select the node with the minimum<br />
(i) f value in the open list<br />
Add the selected node into<br />
the closed list and remove<br />
it from the open list<br />
The selected node<br />
is an outlet<br />
N<br />
Check the adjacent nodes of the<br />
selected node in the open list<br />
Add the adjacent nodes which<br />
are neither in open list nor in<br />
closed list into open list<br />
Establish pointers from these<br />
nodes to the selected node<br />
Traced from the outlet back to<br />
the starting node in the closed<br />
list and adjust the elevations<br />
Generating flow<br />
direction matrix<br />
Y<br />
Where f (i)<br />
is heuristic information value of node i ,<br />
g (i) is the difference from the node i to the starting node,<br />
h (i) is estimated cost, the arithmetic average elevation of<br />
the cells in n-by-n (n=3, 5, 7, …) window centered the<br />
node i , we choose 5 in this article, E s is the elevation<br />
value of the starting node s , E i is the elevation value<br />
the node i , E k is the elevation value the node k , S i is a<br />
set which contains all the nodes in n-by-n window<br />
centered the node i , k is a element of set S i , and S i<br />
is the number of nodes in the set S i .<br />
IV EXPERIMENT AND RESULTS<br />
To examine the suitability and performance of the<br />
proposed algorithm, we implement it in Pascal and make<br />
experiments on actual DEM data. For presentation<br />
purpose all raster maps are converted into vector format.<br />
The study area is “1-degree” DEM which was<br />
provided by the US Geological Survey [22]. The 1-degree<br />
DEM is 1:250,000-scale Digital Elevation Models and<br />
covers an area of 1° in longitude by 1°latitude. The basic<br />
elevation model is produced by the Defense Mapping<br />
Agency (DMA) using cartographic and photographic<br />
sources. The 1-degree DEM consists of a regular array of<br />
elevations referenced horizontally on the geographic<br />
coordinate (latitude/longitude) system of the World<br />
Geodetic System 1984 Datum. Elevations are in meters<br />
relative to mean sea level. The DEM contains 601 rows<br />
by 1201 columns and spacing of the elevations along and<br />
between each profile is 3 arc-seconds.<br />
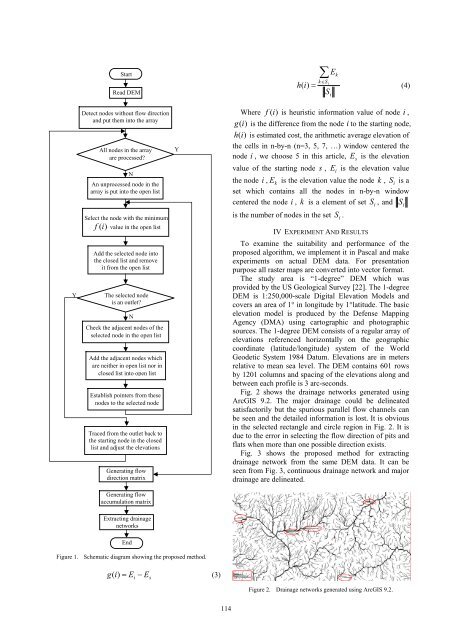
Fig. 2 shows the drainage networks generated using<br />
ArcGIS 9.2. The major drainage could be delineated<br />
satisfactorily but the spurious parallel flow channels can<br />
be seen and the detailed information is lost. It is obvious<br />
in the selected rectangle and circle region in Fig. 2. It is<br />
due to the error in selecting the flow direction of pits and<br />
flats when more than one possible direction exists.<br />
Fig. 3 shows the proposed method for extracting<br />
drainage network from the same DEM data. It can be<br />
seen from Fig. 3, continuous drainage network and major<br />
drainage are delineated.<br />
Generating flow<br />
accumulation matrix<br />
Extracting drainage<br />
networks<br />
End<br />
Figure 1. Schematic diagram showing the proposed method.<br />
g( i)<br />
= E i − E s<br />
(3)<br />
Figure 2. Drainage networks generated using ArcGIS 9.2.<br />
114


