

Download - Academy Publisher
Download - Academy Publisher
Download - Academy Publisher

You also want an ePaper? Increase the reach of your titles
YUMPU automatically turns print PDFs into web optimized ePapers that Google loves.
distance of view point. Given that the distance of view<br />
point was increasing, the vector textures need to become<br />
thicker from the level of L to L+1. The L level is “OUT”<br />
stage, and the L+1 level is “IN” stage. Conversely, when<br />
the point of view gradually decreases, the vector texture<br />
become thinner from L level to L-1 level, the L level is<br />
called “OUT” stage, while the L-1 level called “IN”. As<br />
shown in Fig. 3<br />
B. The determination of target sub-block visibility<br />
For the view point, most domains of the terrain are<br />
invisible, so cutting off that before rendering to accelerate<br />
the speed of terrain rendering. The four tree node consist<br />
of one three-dimensional bounding box which contains<br />
all of its own sub-tree ,its leaf nodes is an actual drawing<br />
of the block bounding box and adjacent to the Terrain<br />
area block of the bounding box. If the leaf nodes of the<br />
bounding box are located partially or entirely within the<br />
visual, then this terrain block can be marked as visible.<br />
Traverse the entire four-node-tree, cutting and processing<br />
from the root, Each block will be marked as visible or not<br />
visible, thus can obtained a collection of plots which<br />
should be rendered.<br />
Target sub-block search in fact accompanied by<br />
resolution of search. If adopt one resolution, then only<br />
related to the regional level search and domain search.<br />
For the use of View-dependent multi-resolution terrain<br />
visualization techniques to simplify the system, Require<br />
different regions corresponding to different resolution<br />
topographic data. Therefore, in sub-block search process<br />
needs resolution test. Fig. 4 is Resolution requirements<br />
for topographic block diagram, the white rectangle that<br />
intersects with the view frustum and the need to<br />
participate in the sub-block data Terrain Rendering, The<br />
smaller rectangular block that higher the resolution<br />
First, determine whether the topography of the region<br />
can be seen that within the data. Testing and visible<br />
regions of the top-level sub-block overlap is to meet the<br />
resolution requirements, if met, will continue to test subbranch<br />
block, until the search out all the requirements to<br />
meet the resolution of sub-blocks. Algorithm steps<br />
described as follows:<br />
[1] Judge whether the Regional and topographic data can<br />
be seen overlapping or not, If the overlap, then enter<br />
the Step 2, otherwise the end.<br />
[2] One by one to judge whether the block to meet the<br />
resolution of top-level requirements, if met, will<br />
insert it into the draw list, or a branch of its four subblocks<br />
A, inserted into the test list.<br />
[3] Judge whether the list is empty, if empty, the<br />
algorithm ended, or else turn to Step 4.<br />
[4] One by one to judge whether the list one by one in<br />
the sub-block is overlapped with the visible region, if<br />
the overlap will insert it into the test list B, otherwise<br />
discard them.<br />
[5] Clear the test list.<br />
[6] Test one by one to determine whether the sub-block<br />
in list B is to meet the resolution requirement, if met,<br />
will insert it into the draw list, or a branch of its four<br />
sub-blocks A, inserted into the test list.<br />
[7] Clear test list B, enter step 2.<br />
When overlapping test, As long as the four corners of<br />
points in the block at any point in the visible region, It<br />
means that the sub-block overlap with the visible region.<br />
For the resolution test, first, calculate the goal resolution<br />
of the four corners, If the goal resolution values of the<br />
four corners are greater than or equal to which in the<br />
pyramid layer.<br />
Ⅴ. EXPERIMENT<br />
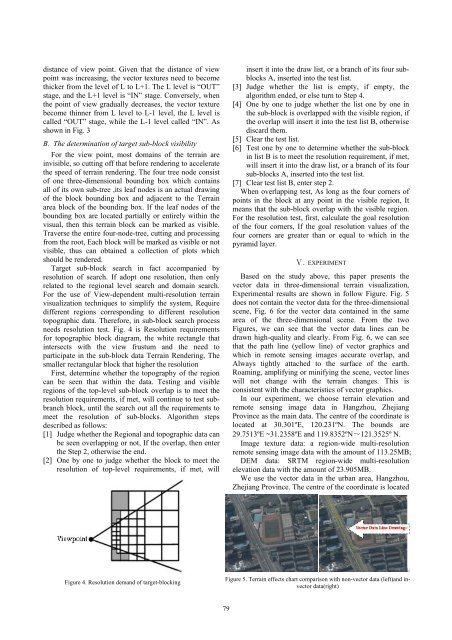
Based on the study above, this paper presents the<br />
vector data in three-dimensional terrain visualization,<br />
Experimental results are shown in follow Figure. Fig. 5<br />
does not contain the vector data for the three-dimensional<br />
scene, Fig. 6 for the vector data contained in the same<br />
area of the three-dimensional scene. From the two<br />
Figures, we can see that the vector data lines can be<br />
drawn high-quality and clearly. From Fig. 6, we can see<br />
that the path line (yellow line) of vector graphics and<br />
which in remote sensing images accurate overlap, and<br />
Always tightly attached to the surface of the earth.<br />
Roaming, amplifying or minifying the scene, vector lines<br />
will not change with the terrain changes. This is<br />
consistent with the characteristics of vector graphics.<br />
In our experiment, we choose terrain elevation and<br />
remote sensing image data in Hangzhou, Zhejiang<br />
Province as the main data. The centre of the coordinate is<br />
located at 30.301ºE, 120.231ºN. The bounds are<br />
29.7513ºE ~31.2358ºE and 119.8352ºN~121.3525º N.<br />
Image texture data: a region-wide multi-resolution<br />
remote sensing image data with the amount of 113.25MB;<br />
DEM data: SRTM region-wide multi-resolution<br />
elevation data with the amount of 23.905MB.<br />
We use the vector data in the urban area, Hangzhou,<br />
Zhejiang Province. The centre of the coordinate is located<br />
Figure 4. Resolution demand of target-blocking<br />
Figure 5. Terrain effects chart comparison with non-vector data (left)and invector<br />
data(right)<br />
79


