- Page 2 and 3:
THE BUCHAREST ACADEMY OF ECONOMIC S
- Page 4 and 5:
CONTENTS Preface PS1 Auditing Chair
- Page 6 and 7:
ENTERPRISE 2.0 - IS THE MARKET READ
- Page 8 and 9:
SEMANTIC ANNOTATION AND ASSOCIATION
- Page 10 and 11:
ACCOUNTING PRINCIPLES AND BOOK-TAX
- Page 12 and 13:
EMPIRICAL STUDY REGARDING KEY INDIC
- Page 14 and 15:
She is the Accounting Department Ed
- Page 16 and 17:
AUDIT COMMITTEES AS INCREASING VECT
- Page 18 and 19:
took into account the essential rol
- Page 20 and 21:
independence, competence, professio
- Page 22 and 23:
shareholders as companies’ owners
- Page 24 and 25:
expertise which could control the m
- Page 26 and 27:
information asymmetry. According to
- Page 28 and 29:
indicators reducing audit quality),
- Page 30 and 31:
This study reflects my own opinion
- Page 32 and 33:
Malone, C.F. & Roberts, R.W. (1996)
- Page 34 and 35:
findings. As the audit process is a
- Page 36 and 37:
(Weber et al., 2002) present a psyc
- Page 38 and 39:
2. RESEARCH METHODOLOGY The researc
- Page 40 and 41:
isk behaviour using the SPSS statis
- Page 42 and 43:
conclusion of this study, that age
- Page 44 and 45:
APPENDIX 1 The research questionnai
- Page 46 and 47:
THE INVESTIGATION OF ROMANIAN AUDIT
- Page 48 and 49:
1. ROLE AND PRACTICES OF INTERNAL A
- Page 50 and 51:
• Internal audit assist the board
- Page 52 and 53:
But there are only few papers that
- Page 54 and 55:
14. Internal audit should discussed
- Page 56 and 57:
have its place in the repertoire of
- Page 58 and 59:
11 Internal audit assists board/aud
- Page 60 and 61:
16 Internal audit is preoccupied by
- Page 62 and 63:
Chief of internal audit department
- Page 64 and 65:
Based on the above tables, we propo
- Page 66 and 67:
the answers and resending some foll
- Page 68 and 69:
Sarens G (2009) „Internal auditin
- Page 70 and 71:
PUBLIC SECTOR PERFORMANCE FROM THE
- Page 72 and 73:
integrating social responsibility i
- Page 74 and 75:
Administration, the Ministries, oth
- Page 76 and 77:
The research points out that there
- Page 78 and 79:
odies disclose information on the s
- Page 80 and 81:
On one hand, it helps them to build
- Page 82 and 83:
Steps Description Implement CSR com
- Page 84 and 85:
Gjølberg, M. (2009) „Measuring t
- Page 86 and 87:
ANNEX 1 Disclosures on social respo
- Page 88 and 89:
Country Name of Institution Finland
- Page 90 and 91:
Country Name of Institution The The
- Page 92 and 93:
IMPROVEMENT IN ACCOUNTING SYSTEM AN
- Page 94 and 95:
1.2. Improved accounting system (H1
- Page 96 and 97:
Shields and Shields (1998) have rev
- Page 98 and 99:
Flamholtz (1983) argues that accoun
- Page 100 and 101:
2. VARIABLE MEASUREMENT For variabl
- Page 102 and 103:
To analyse the data, Structural Equ
- Page 104 and 105:
eliable. Of all indices in Table 2
- Page 106 and 107:
e10 e9 e8 e7 e6 e5 e4 e3 e2 e1 Figu
- Page 108 and 109:
DISCUSSION AND CONCLUSION By lookin
- Page 110 and 111:
of SEM as the main data analysing p
- Page 112 and 113:
Cooper, R. (1995). When lean enterp
- Page 114 and 115:
Modell, S., Lee, A., Tjenesteproduk
- Page 116 and 117:
a centrally planned economy era and
- Page 118 and 119:
are used and respected by the major
- Page 120 and 121:
Financial control Figure 1. Managem
- Page 122 and 123:
Table 2. The evolution of the defin
- Page 124 and 125:
Poland, a different solution has be
- Page 126 and 127:
continuous quality improvement by s
- Page 128 and 129:
• has full legal capacity and mak
- Page 130 and 131:
and metrics to measure efficiency.
- Page 132 and 133:
Currently, internal audit is becomi
- Page 134 and 135:
BOUNDRIES REGARDING THE IMPLEMENTAT
- Page 136 and 137:
including the credit institutions a
- Page 138 and 139:
What are the coordinates of this na
- Page 140 and 141:
• improving the quality of inform
- Page 142 and 143:
the parent companies prepare the co
- Page 144 and 145:
statements and the audit report, it
- Page 146 and 147:
The Insurance Supervisory Commissio
- Page 148 and 149:
eform went ahead the economy reform
- Page 150 and 151:
PS3 Financial analysis I Chairperso
- Page 152 and 153:
to-unit root properties. Thus, ther
- Page 154 and 155:
we use the “Windmeijer correction
- Page 156 and 157:
2.2. Results Our preliminary evalua
- Page 158 and 159:
M1 and M2 are tests for first-order
- Page 160 and 161:
Goyal A., Welch I., (2003) „Predi
- Page 162 and 163:
' ∑ = LΛL ( a.4. ) Here L is the
- Page 164 and 165:
Among these categories, the first i
- Page 166 and 167:
Authors Main tested method Sample c
- Page 168 and 169:
pay more attention to accurately cl
- Page 170 and 171:
whose total assets were below 100K
- Page 172 and 173:
Step 6: An algorithm based on multi
- Page 174 and 175:
called knots, nodes or breakdown po
- Page 176 and 177:
RMSECV = n ∑ i= 1 ( y − yˆ ) i
- Page 178 and 179:
the whole database and performed fi
- Page 180 and 181:
Bank for International Settlements
- Page 182 and 183:
Martikainen, T., Perttunen, J., Yli
- Page 184 and 185:
THE RELEVANCE OF COMPANY EVALUATION
- Page 186 and 187:
qualitative data, present in the co
- Page 188 and 189:
Although financial theory criticize
- Page 190 and 191:
isk (one characterized by the insol
- Page 192 and 193:
Table 3. List of the companies in t
- Page 194 and 195:
each of the three variables: 1 - lo
- Page 196 and 197:
Table 4. Coefficients of the classi
- Page 198 and 199:
a total error for the case when thi
- Page 200 and 201:
ACKNOWLEDGEMENTS This work was supp
- Page 202 and 203:
FINANCIAL RISK ANALYSIS AT THE STOC
- Page 204 and 205:
society we live in. Additionally, r
- Page 206 and 207:
loans of the banking system, they m
- Page 208 and 209:
Graph 1. CLF evolutions during 2005
- Page 210 and 211:
The times we are living require the
- Page 212 and 213:
BENEFITS AND COSTS OF PREPARING IFR
- Page 214 and 215:
1.2. Paper’s aim and contribution
- Page 216 and 217:
� introduction of basic principle
- Page 218 and 219:
• the consistency of adjustments
- Page 220 and 221:
� all-in-one solution, when entit
- Page 222 and 223:
• Voluntary application of the IF
- Page 224 and 225:
other sophisticated systems are use
- Page 226 and 227:
Certainly Rather yes Rather not Cer
- Page 228 and 229:
classified as investments in associ
- Page 230 and 231:
PS5 Fair value Chairperson Mihaela
- Page 232 and 233:
1. BACKGROUND The main objective of
- Page 234 and 235:
transactions involving identical or
- Page 236 and 237:
and the representative body which t
- Page 238 and 239:
market data (see paragraphs 36 and
- Page 240 and 241:
The most advantageous market is the
- Page 242 and 243:
Question 10 With the sixth question
- Page 244 and 245:
proposed guidance does not sufficie
- Page 246 and 247:
% 100,00 80,00 60,00 40,00 20,00 0,
- Page 248 and 249:
the criticisms and suggestions, the
- Page 250 and 251:
AN ENTERPRISE ONTOLOGICAL APPROACH
- Page 252 and 253:
example, in this sense, constitutes
- Page 254 and 255:
• Setting properties for each cla
- Page 256 and 257:
3.5. Defining properties for classe
- Page 258 and 259:
McCarthy W.E. (1982), “The REA ac
- Page 260 and 261:
1. RESEARCH METHODOLOGY This attemp
- Page 262 and 263:
novelty, the difference resides in
- Page 264 and 265:
comes with unlimited scalability at
- Page 266 and 267:
the main reason to embrace Enterpri
- Page 268 and 269:
• A large multinational company p
- Page 270 and 271:
fluctuating demands, and cost savin
- Page 272 and 273:
development, taking advantage of th
- Page 274 and 275:
The adoption of the new software di
- Page 276 and 277:
NON-TECHNICAL CHALLENGES IN ADOPTIN
- Page 278 and 279:
• The virtualization techniques a
- Page 280 and 281:
identification of compliance reques
- Page 282 and 283:
overloaded. In such situations, ins
- Page 284 and 285:
alternative, able to significantly
- Page 286 and 287:
or reliability issues. As the cloud
- Page 288 and 289:
CRITICAL SUCCESS FACTORS FOR THE OR
- Page 290 and 291:
Data breaches is in the forefront o
- Page 292 and 293:
Enterprise Governance is a relative
- Page 294 and 295:
These four domains are interrelated
- Page 296 and 297:
3.2 Oracle database audit steps Thr
- Page 298 and 299:
• Export files The auditor should
- Page 300 and 301:
• Access and authorization All us
- Page 302 and 303:
REFERENCES Al Marcella (2006) IT Au
- Page 304 and 305:
USE OF FINANCIAL SECURITIES IN THE
- Page 306 and 307:
etween the listing of accounting un
- Page 308 and 309:
within the latter becomes possible
- Page 310 and 311:
Price/Earnings ratio model is a ver
- Page 312 and 313:
Bills of exchange and checks repres
- Page 314 and 315:
Pirchegger (2006) is concerned with
- Page 316 and 317:
ACKNOWLEDGEMENTS This paper is one
- Page 318 and 319:
THE FINANCIAL INNOVATION AND THE DY
- Page 320 and 321:
The financial engineering represent
- Page 322 and 323:
characteristics: form (capital mark
- Page 324 and 325:
Compared with the ETFs, the options
- Page 326 and 327:
Graph 1. The evolution of ETFs at g
- Page 328 and 329:
5.5 billion $, the most important f
- Page 330 and 331:
Figure 1. Mainstream View of Global
- Page 332 and 333:
seams to intensify the pessimism of
- Page 334 and 335:
Marshall, J. & Bansal, V. (2004) Fi
- Page 336 and 337:
selection had the strongest impact
- Page 338 and 339:
n+ 1 m ∑ri X i + ∑R j z j = ∑
- Page 340 and 341:
2. FUZZY MIXED SECURITIES PORTFOLIO
- Page 342 and 343:
Figure 4. The membership function f
- Page 344 and 345:
We already have the values of f M a
- Page 346 and 347:
CONCLUSIONS We can conclude by show
- Page 348 and 349:
THE ROLE OF FINANCIAL DESCRIPTORS I
- Page 350 and 351:
� Leverage (GI) - reflect the tot
- Page 352 and 353:
each unit of risk. It is calculated
- Page 354 and 355:
Analyzing these results shows that
- Page 356 and 357:
In the short portfolios case only t
- Page 358 and 359:
APPENDIX 1 Issuing companies from t
- Page 360 and 361:
APPENDIX 3 Issuing companies from t
- Page 362 and 363:
APPENDIX 5 Issuing companies from t
- Page 364 and 365:
Issuers Reverse of the historical v
- Page 366 and 367:
Issuers Reverse of the historical v
- Page 368 and 369:
Issuers Reverse of the historical v
- Page 370 and 371:
INTELLECTUAL CAPITAL DISCLOSURE: EU
- Page 372 and 373:
Similarly, Stewart (1997) considers
- Page 374 and 375:
In a manner similar to prior resear
- Page 376 and 377:
information related to their intang
- Page 378 and 379:
As shown in Figure 3, within extern
- Page 380 and 381:
Bontis, N. (1998). “Intellectual
- Page 382 and 383:
this capital, which contains non-fi
- Page 384 and 385:
external capital (the customers - c
- Page 386 and 387:
The image of the company Supply and
- Page 388 and 389:
Infrastructure assets (corporate cu
- Page 390 and 391:
Table 2. The analyzed elements of i
- Page 392 and 393:
• as for the human capital, four
- Page 394 and 395:
APPENDIX 1 The analyzed entities En
- Page 396 and 397:
DETERMINANTS OF INTELLECTUAL CAPITA
- Page 398 and 399:
from the work performed by a panel
- Page 400 and 401:
Garcia-Meca et al. (2005) used univ
- Page 402 and 403:
comprehensive in some industries, s
- Page 404 and 405:
eliable data, a rigorous and transp
- Page 406 and 407:
textile/clothing, and tourism/leisu
- Page 408 and 409:
External (customer/relational) capi
- Page 410 and 411:
This output shows for each of the 4
- Page 412 and 413:
ICD_Index Equal variances assumed E
- Page 414 and 415:
hypothesis H3 and thus we can state
- Page 416 and 417:
Lang, M. and Lundholm, R. (1993)
- Page 418 and 419:
IMPACTS AND CHANGES IN THE ACCOUNTI
- Page 420 and 421:
the IAS adoption caused fundamental
- Page 422 and 423:
policies, we examined the net incom
- Page 424 and 425:
policy was established by the recog
- Page 426 and 427:
Table 2. IAS under examination, ten
- Page 428 and 429:
as tangible assets and their subseq
- Page 430 and 431:
Rahman, A., Perera, H. and Ganesh,
- Page 432 and 433:
PS10 Performance management Chairpe
- Page 434 and 435:
• comparative analysis between co
- Page 436 and 437:
investment in infrastructure, once
- Page 438 and 439:
Romtelecom has undergone a major tr
- Page 440 and 441:
LRIC models provide cost orientatio
- Page 442 and 443:
are primarily used for performance
- Page 444 and 445:
Dnes, A. (1995), “Post-privatizat
- Page 446 and 447:
considered under a different statem
- Page 448 and 449:
• The need to simulate efficient
- Page 450 and 451:
We considered this as well, by usin
- Page 452 and 453:
Aspect Focus Systems Development A
- Page 454 and 455:
Tabel 3. Internal process design Me
- Page 456 and 457:
the manager with the actual figures
- Page 458 and 459:
***http://www.isaca.org - IASCA sit
- Page 460 and 461:
The concept of sustainable developm
- Page 462 and 463:
Managers need to know all about the
- Page 464 and 465:
Table 3 Cumulative number of batche
- Page 466 and 467:
From another point of view, indicat
- Page 468 and 469:
Code has been modified through Law
- Page 470 and 471:
Another reason for termination of a
- Page 472 and 473:
and legal authorisations expired. H
- Page 474 and 475:
interdiction of dismissal can be ex
- Page 476 and 477:
Though dismissal due to professiona
- Page 478 and 479:
The rules regarding the collective
- Page 480 and 481:
If, on the contrary, the flexibilit
- Page 482 and 483:
PS11 Management information systems
- Page 484 and 485:
governments. The primary values of
- Page 486 and 487:
� with legacy applications- who n
- Page 488 and 489:
strategies behind the deployment of
- Page 490 and 491:
• iKP (Internet Keyed Payments Pr
- Page 492 and 493:
• Many alternative protocol paths
- Page 494 and 495:
specific problems are associated wi
- Page 496 and 497:
Boping, Z. & Shiyu, S., (2009), ”
- Page 498 and 499:
ehavior - meaning how to act over t
- Page 500 and 501:
Structuring the educational content
- Page 502 and 503:
pedagogical object is annotated usi
- Page 504 and 505:
associative). This aspect is repres
- Page 506 and 507:
Integration of ontologies Figure 5.
- Page 508 and 509:
Language) and an extension of RDF a
- Page 510 and 511:
Reviewing some relevant papers (Isf
- Page 512 and 513:
Figure 10. Ontology for detailing t
- Page 514 and 515:
Pernin, J.P. (2004) LOM, SCORM et I
- Page 516 and 517:
these documents are still difficult
- Page 518 and 519:
Figure 2. Framework for semantic an
- Page 520 and 521:
Figure 4. Semantic annotation using
- Page 522 and 523:
• It should verify the credential
- Page 524 and 525:
Each skill from the job offer ( ) i
- Page 526 and 527:
3.2. IT competency ontologies withi
- Page 528 and 529:
10. Computer network administrator
- Page 530 and 531:
items were required, such as ”Wor
- Page 532 and 533:
Hernandez, N. (2005), “Ontologies
- Page 534 and 535:
The current limitations in the qual
- Page 536 and 537:
The assurance of Business Intellige
- Page 538 and 539:
In the case study mentioned at tier
- Page 540 and 541:
improve performance. The ability to
- Page 542 and 543:
One key benefit to our system is th
- Page 544 and 545:
Grossmann Wilfried (2010), “A Con
- Page 546 and 547:
CORPORATE VALUES, THE COMPANIES’
- Page 548 and 549:
1.2. The Lack of Trust or the Crisi
- Page 550 and 551:
an impact on the individual behavio
- Page 552 and 553:
By making their corporate values pu
- Page 554 and 555:
The second situation appears when t
- Page 556 and 557:
geographical area. Regarding the fi
- Page 558 and 559:
sector ranked by market capitalizat
- Page 560 and 561:
ehaviour. Only few managers will ad
- Page 562 and 563:
Table 5. The value system of the Fr
- Page 564 and 565:
Anon, (2002b). “Most executives s
- Page 566 and 567:
HOW CAN CORPORATE GOVERNANCE MITIGA
- Page 568 and 569:
Studies on frauds have emphasized t
- Page 570 and 571:
environmental or situational factor
- Page 572 and 573:
and later in the documentation phas
- Page 574 and 575:
Knowing the factors that contribute
- Page 576 and 577:
• Have audit committee members pa
- Page 578 and 579:
� strengthen regulations as for e
- Page 580 and 581:
REFERENCES AICPA (2005) Management
- Page 582 and 583:
created by the new technology, by t
- Page 584 and 585:
Figure 2. Connection between compan
- Page 586 and 587:
The companies that meet the positiv
- Page 588 and 589:
employed, their families would lack
- Page 590 and 591:
Phishing. There are numerous traps
- Page 592 and 593:
competence and doesn’t understand
- Page 594 and 595:
CORPORATE GOVERNANCE PRINCIPLES: AN
- Page 596 and 597:
• Executive directors should be a
- Page 598 and 599:
The corporate governance system in
- Page 600 and 601:
set out by the OECD in a general ma
- Page 602 and 603:
• 32% of the companies (21 out of
- Page 604 and 605:
Period Emerging economies and corpo
- Page 606 and 607:
• Customers: Most stakeholder mod
- Page 608 and 609:
and The Remuneration Committee cons
- Page 610 and 611:
CONCLUSIONS Starting from transpare
- Page 612 and 613:
Richard, B. and Miellet, D. (2002),
- Page 614 and 615:
IMPACT OF FUNDED STATUS OF PENSIONS
- Page 616 and 617:
wage level, national average earnin
- Page 618 and 619:
foreign currency in reserve currenc
- Page 620 and 621:
THE IMPACT OF UNREALISED FOREIGN EX
- Page 622 and 623:
y the foreign exchange differences
- Page 624 and 625:
However, the entity has not conduct
- Page 626 and 627:
What means "fictitious or non-distr
- Page 628 and 629:
difficult economic situation at gen
- Page 630 and 631:
VALUE RELEVANCE OF CONSOLIDATED VER
- Page 632 and 633:
market value relevance studies (Hel
- Page 634 and 635:
capital market as a whole, since th
- Page 636 and 637:
Share prices for the sampled observ
- Page 638 and 639:
Hypothesis 2: The value relevance o
- Page 640 and 641:
In order to test if an eventual rel
- Page 642 and 643:
Table 5. Correlation matrix of vari
- Page 644 and 645:
Table 7. Empirical results for regr
- Page 646 and 647:
Figure 2. Evolution of value releva
- Page 648 and 649:
(Francis, 1986: 394). We consider t
- Page 650 and 651:
Niskanen, J., Kinnunen, J. and Kasa
- Page 652 and 653:
must be able to accurately demonstr
- Page 654 and 655:
Market surveys show that the main p
- Page 656 and 657:
party, with only one condition: tha
- Page 658 and 659:
accounting activity. Also, professi
- Page 660 and 661:
PS14 Management information systems
- Page 662 and 663:
Due to these changes in the economy
- Page 664 and 665:
to the computer system, the acquisi
- Page 666 and 667:
The importance of IT Risk and Compl
- Page 668 and 669:
Factor - objective The Customer (In
- Page 670 and 671:
The security requirements for cloud
- Page 672 and 673:
Figure 5. General framework for inf
- Page 674 and 675:
ISMS Process (Source: Applying ISO
- Page 676 and 677:
greater confidence in the organizat
- Page 678 and 679:
Băbeanu D, (2008), Information str
- Page 680 and 681:
A TEST OF DIFFERENT MODELS FOR THE
- Page 682 and 683:
2003; Braga et al., 2007). For a re
- Page 684 and 685:
Where Y is the software effort, x i
- Page 686 and 687:
means that multiplying inputs x and
- Page 688 and 689:
The Desharnais dataset contains ele
- Page 690 and 691:
very far away from the predicted va
- Page 692 and 693:
Braga, P.L, Oliveira, A.L.I, Ribeir
- Page 694 and 695:
Sayyad Shirabad, J. and Menzies, T.
- Page 696 and 697:
First, during the development cycle
- Page 698 and 699:
If it’s calculated: Δk = CSIk -
- Page 700 and 701:
For emerging organizations, among t
- Page 702 and 703:
which connects is audited and the r
- Page 704 and 705:
THE EFFICIENCY OF SMALL AND MEDIUM
- Page 706 and 707:
1. LITERATURE REVIEW 1.1. Tendencie
- Page 708 and 709:
included in the category of develop
- Page 710 and 711:
It was interesting to discover whic
- Page 712 and 713:
2.2 Why are web-based applications
- Page 714 and 715:
Figure 1. Web based accounting arch
- Page 716 and 717:
From this module data are translate
- Page 718 and 719:
Table 2. The relation between the l
- Page 720 and 721:
Groza C., Briciu S., Cordos A.M, (2
- Page 722 and 723:
present the information, but is dif
- Page 724 and 725:
The second step was to establish th
- Page 726 and 727:
Academic Journals Total 5 Computer
- Page 728 and 729:
Table 4. Articles that mention XBRL
- Page 730 and 731:
and Kogan, 2010; Debreceny et al.,
- Page 732 and 733:
Hou, X., Hu. G, Ma, L., Liu, T., Pa
- Page 734 and 735:
15, 2009 on, the largest companies
- Page 736 and 737:
common base taxonomies like an IFRS
- Page 738 and 739:
Increasing comparability Improving
- Page 740 and 741:
3. INDEPENDENT VARIABLES DISCUSSION
- Page 742 and 743:
(1982) found no link between profit
- Page 744 and 745:
Table 1. Overview of Sample firms N
- Page 746 and 747:
information covers 40 items, non-fi
- Page 748 and 749:
No. Firms Overall Disclosures XBRL
- Page 750 and 751:
Table 4. Sample Characteristics Var
- Page 752 and 753:
Table 7. Model summaries for overal
- Page 754 and 755:
(Healy and Palepu 2001). Finally, t
- Page 756 and 757:
Gray, S., Meek, G. and Roberts, C.
- Page 758 and 759:
Trabelsi, S., Labelle, R. and Lauri
- Page 760 and 761:
OBLIGATION OR OPPORTUNITY FOR DRAWI
- Page 762 and 763:
IFRS for SMEs provides that, beside
- Page 764 and 765:
financial statements. We assume tha
- Page 766 and 767:
statements. The group of subjects w
- Page 768 and 769:
statements before, the questionnair
- Page 770 and 771:
Popa M. (2006), “Elemente sinteti
- Page 772 and 773:
INTRODUCTION The preparation of a s
- Page 774 and 775:
should also affect the recognition
- Page 776 and 777:
consolidated accounting remained in
- Page 778 and 779:
accounting regulations, for small a
- Page 780 and 781:
The standard published by IASB, in
- Page 782 and 783:
Chart 4. Q7 Responses Nevertheless,
- Page 784 and 785:
After processing the collected data
- Page 786 and 787:
(turnover, average number of employ
- Page 788 and 789:
ACCOUNTING PRINCIPLES AND BOOK-TAX
- Page 790 and 791:
literally several provisions of the
- Page 792 and 793:
treatments. For instance, the share
- Page 794 and 795:
however to be enlarged upon and als
- Page 796 and 797:
4.5. Separate evaluation of assets
- Page 798 and 799:
Moreover, the legal documents suppo
- Page 800 and 801:
(Slemrod and Blumenthal, 1996). In
- Page 802 and 803:
D’Ascenzo, Michael; England, Andr
- Page 804 and 805:
Walker, D. I. (2007), „Financial
- Page 806 and 807:
FUNDAMENTAL DETERMINANTS OF CAPITAL
- Page 808 and 809:
companies, we found a statistical s
- Page 810 and 811:
The “free cash flow” term is th
- Page 812 and 813:
investments are "lumpy" and positiv
- Page 814 and 815:
estructuring process of the compani
- Page 816 and 817:
For the analysis model between the
- Page 818 and 819:
Table 4. Relationship between FL, T
- Page 820 and 821:
CONCLUSIONS There is no universal t
- Page 822 and 823: IMPACT OF LONG-TERM INVESTMENT DECI
- Page 824 and 825: 1. PRESENTATION OF THE SCIENTIFIC P
- Page 826 and 827: The equation shows that maintaining
- Page 828 and 829: or expense. expense. ( * 100) N < (
- Page 830 and 831: As we mentioned in the previous sub
- Page 832 and 833: maintain the quality of the operati
- Page 834 and 835: INCLUDING BEHAVIOURAL ELEMENTS IN A
- Page 836 and 837: � the strong form - all informati
- Page 838 and 839: Cognitive biases (Moderate) 3. COGN
- Page 840 and 841: method with the next results: ancho
- Page 842 and 843: 3.7. Cognitive dissonance bias When
- Page 844 and 845: versus development potential. The t
- Page 846 and 847: This bias could determine the inves
- Page 848 and 849: 5.2. Anchoring bias You bought two
- Page 850 and 851: • I am looking at the returns but
- Page 852 and 853: • Even if I am very satisfied wit
- Page 854 and 855: 60 50 40 30 20 10 60 50 40 30 20 10
- Page 856 and 857: DISCUSSION AND CONCLUSIONS The main
- Page 858 and 859: Hirshleifer, D., Hou, K S., Teoh, H
- Page 860 and 861: Sinha, G. (2005) „Training the br
- Page 862 and 863: ACCOUNTING STUDENTS’ ACADEMIC PER
- Page 864 and 865: 1. ACCOUNTING STUDENTS’ ACADEMIC
- Page 866 and 867: principles class. A more particular
- Page 868 and 869: As previously mentioned, the questi
- Page 870 and 871: After developing the two methodolog
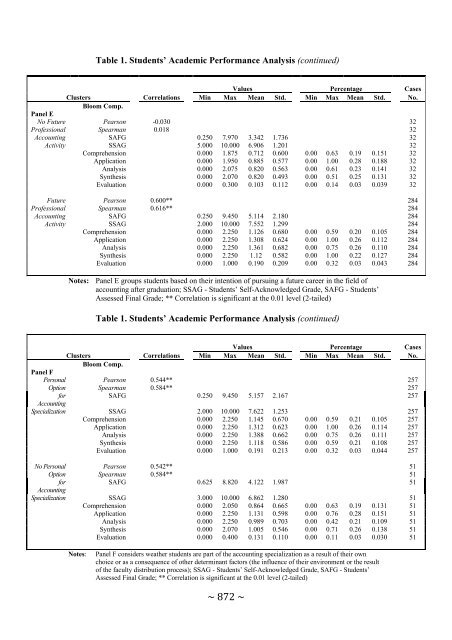
- Page 874 and 875: Table 1. Students’ Academic Perfo
- Page 876 and 877: etween the two calculated means to
- Page 878 and 879: Cluster analysis being performed wi
- Page 880 and 881: Mcduffie, S. and Smith, L.M (2006),
- Page 882 and 883: Nobes and Parker (2008) argue that
- Page 884 and 885: • The creation of a hierarchy of
- Page 886 and 887: demanders of that education” (Ame
- Page 888 and 889: The results of chi-square test appl
- Page 890 and 891: ecommended by IES 2 (Content Progra
- Page 892 and 893: REFERENCES The Academy of Economic
- Page 894 and 895: naturally succeed on the organizati
- Page 896 and 897: negotiation table, where they are t
- Page 898 and 899: It is relatively easy to observe th
- Page 900 and 901: Carr, C., (1990) Front-line Custome
- Page 902 and 903: Figure 1. Social networking became
- Page 904 and 905: 1. LITERATURE REVIEW Formerly desig
- Page 906 and 907: The base concept for Twitter is to
- Page 908 and 909: 2. STUDY METHODOLOGY Lee and McLoug
- Page 910 and 911: Figure 7. Structure of the survey p
- Page 912 and 913: Figure 10. Frequency of access (ema
- Page 914 and 915: have to be better trained to protec
- Page 916 and 917: ANNEX 1 Questionnaire on the impact
- Page 918 and 919: The first works in Romanian, in the
- Page 920 and 921: However, after 10 years, the Transy
- Page 922 and 923:
century when the economic life star
- Page 924 and 925:
first accounting manual written in
- Page 926 and 927:
category, and those of owners equit
- Page 928 and 929:
Cluj, also called College, was orga
- Page 930 and 931:
� the political influence and the
- Page 932 and 933:
Jinga, 1943:1). During its 14 years
- Page 934 and 935:
The accounting literature is rich a
- Page 936 and 937:
4.2.2. Influence of European practi
- Page 938 and 939:
Due to the foundation of the Academ
- Page 940 and 941:
PS19 Financial markets Chairperson
- Page 942 and 943:
attempt to predict future prices, n
- Page 944 and 945:
In the context of IFRS adoption, th
- Page 946 and 947:
Advisory Group (FCAG) which compris
- Page 948 and 949:
milestones that, if achieved, may l
- Page 950 and 951:
250 Japanese companies are listed o
- Page 952 and 953:
Graphic 1. Recent evolutions of DJI
- Page 954 and 955:
1 ˆ μ = T T ∑ i= 1 2 σ Tq and
- Page 956 and 957:
p values are computed directly from
- Page 958 and 959:
Cheung, K.C. and Coutts, J.A. (2001
- Page 960 and 961:
PROPERTIES OF ANALYSTS’ FORECASTS
- Page 962 and 963:
Several recent papers have showed t
- Page 964 and 965:
Observations Minimum Maximum Mean S
- Page 966 and 967:
Olimid. L., Ionaşcu M., Popescu L.
- Page 968 and 969:
� recognizing expenses in three p
- Page 970 and 971:
This study is structured in the fol
- Page 972 and 973:
eassessment, it is easily to make i
- Page 974 and 975:
only 9 companies have written out t
- Page 976 and 977:
• for calculation correlation deg
- Page 978 and 979:
Figure 1.The distribution of financ
- Page 980 and 981:
The 2 β coefficient in the formula
- Page 982 and 983:
Entities nomber Table 3. Difference
- Page 984 and 985:
coefficient, for both the correlati
- Page 986 and 987:
COMPANY NAME Balance sheet date Sto
- Page 988 and 989:
ANNEX 3 (amounts in pounds or centi
- Page 990 and 991:
EXPLORATORY STUDY ON SOCIAL AND ENV
- Page 992 and 993:
equirements with their implementati
- Page 994 and 995:
are motivated by national environme
- Page 996 and 997:
We created a database containing in
- Page 998 and 999:
process to implement at an extended
- Page 1000 and 1001:
We noticed that an important percen
- Page 1002 and 1003:
CSR sections in the annual report i
- Page 1004 and 1005:
CONCLUSIONS The qualitative aspects
- Page 1006 and 1007:
Lungu, C.I., Caraiani, C., Dascalu,
- Page 1008 and 1009:
into new territories, destruction c
- Page 1010 and 1011:
Attempts by economists to describe
- Page 1012 and 1013:
essential to establish a monotony p
- Page 1014 and 1015:
There is an observable prevalence o
- Page 1016 and 1017:
source and detect the sensor, givin
- Page 1018 and 1019:
stimulating system is manifesting,
- Page 1020 and 1021:
Decision-maker = Organized actions/
- Page 1022 and 1023:
Cline, W. R. (1992) The Economics o
- Page 1024 and 1025:
Vogtländer, J.,(2010) LCA-based as
- Page 1026 and 1027:
1. ENVIRONMENTAL REGULATION IN ROMA
- Page 1028 and 1029:
H5: The financial performance of en
- Page 1030 and 1031:
No. Environmental information detai
- Page 1032 and 1033:
environmental reporting than the en
- Page 1034 and 1035:
It can be thus concluded, that the
- Page 1036 and 1037:
CONCLUSIONS The level of environmen
- Page 1038 and 1039:
Gamble, G.O., Hsu, K., Kite, D. and
- Page 1040 and 1041:
APPENDIX 1 Description of the varia
- Page 1042 and 1043:
Compa 1 1 2 77 301563792 1860 1 2 2
- Page 1044 and 1045:
greater attachment to the area amon
- Page 1046 and 1047:
process of the compartment the info
- Page 1048 and 1049:
Figure 2. Table of the allocation o
- Page 1050 and 1051:
eallocation of the resources needed
- Page 1052 and 1053:
• point d), Non distributable val
- Page 1054 and 1055:
where: • IVCRSPam(t;s) = Intangib
- Page 1056 and 1057:
The same reflection concerns the en
- Page 1058 and 1059:
the function to compensate possible
- Page 1060 and 1061:
Giovanelli, F. and Di Bella, I. and
- Page 1062 and 1063:
THE IMPACT OF THE SUSTAINABLE DEVEL
- Page 1064 and 1065:
too small, the revenues and, as a c
- Page 1066 and 1067:
the customers might refuse to pay o
- Page 1068 and 1069:
Among other financing sources, we c
- Page 1070 and 1071:
time, a rising fuel price will also
- Page 1072 and 1073:
Subsidies are granted in order to p
- Page 1074 and 1075:
energy comes to complete the conven
- Page 1076 and 1077:
EMPIRICAL STUDY REGARDING KEY INDIC
- Page 1078 and 1079:
Forum and Joint Research Centre of
- Page 1080 and 1081:
institutions show that investors te
- Page 1082 and 1083:
Minimum of 39.1 to a Maximum of 95.
- Page 1084 and 1085:
EPI 100 90 80 70 60 50 40 30 Figure
- Page 1086 and 1087:
The determination rapport (R-square
- Page 1088 and 1089:
Environmental challenges come in ma
- Page 1090 and 1091:
PS21 Management information systems
- Page 1092 and 1093:
1. INFORMATION The information assu
- Page 1094 and 1095:
2.1. The benefits of information
- Page 1096 and 1097:
2.3. How line managers use informat
- Page 1098 and 1099:
Figure 2. CATWOE illustration of in
- Page 1100 and 1101:
We can assume that the problems enu
- Page 1102 and 1103:
time deliveries between each link o
- Page 1104 and 1105:
• Reliability and safety. Paralle
- Page 1106 and 1107:
From the customer perspective an ER
- Page 1108 and 1109:
There are two methodologies for imp
- Page 1110 and 1111:
Hotăran, I. & Horga, G. (2010) “
- Page 1112 and 1113:
database vendors, is mainly about d
- Page 1114 and 1115:
• The first is the business aspec
- Page 1116 and 1117:
of it, to dig out meaningful relati
- Page 1118 and 1119:
Traditional analytical tools claim
- Page 1120 and 1121:
2.1 Analytics get more embedded int
- Page 1122 and 1123:
The most spread analytical tools fo
- Page 1124 and 1125:
DISCUSSION AND CONCLUSIONS Data con
- Page 1126 and 1127:
PS22 Management accounting Chairper
- Page 1128 and 1129:
in traditional management accountin
- Page 1130 and 1131:
in order to fulfil the needs of cen
- Page 1132 and 1133:
Very similar research had been perf
- Page 1134 and 1135:
Brierley, J.A., Cowton, C.J., Drury
- Page 1136 and 1137:
THE ROLE OF COSTS AND CONTROL IN EN
- Page 1138 and 1139:
Performance optimization is transla
- Page 1140 and 1141:
6. The value adding chain must assu
- Page 1142 and 1143:
This is why the size of the target
- Page 1144 and 1145:
To establish: 1. target cost and es
- Page 1146 and 1147:
When the business opportunities are
- Page 1148 and 1149:
an increase in profit equal to the
- Page 1150 and 1151:
THE CHANGE IN MANAGEMENT ACCOUNTING
- Page 1152 and 1153:
1. THE ANALYSIS OF CHANGE IN THE MA
- Page 1154 and 1155:
manner in which the speech is desig
- Page 1156 and 1157:
published in Romanian journals. The
- Page 1158 and 1159:
published on a particular segment,
- Page 1160 and 1161:
2003; GCF, 2003; AMIS), target cost
- Page 1162 and 1163:
Risk management 3 2 2.86 2 25 Inter
- Page 1164 and 1165:
From the research methodology point
- Page 1166 and 1167:
Glăvan, M., Brăescu (Dumitru), M.