World Oil Outlook - Opec
World Oil Outlook - Opec
World Oil Outlook - Opec
- TAGS
- world
- outlook
- opec
- www.opec.org
Create successful ePaper yourself
Turn your PDF publications into a flip-book with our unique Google optimized e-Paper software.
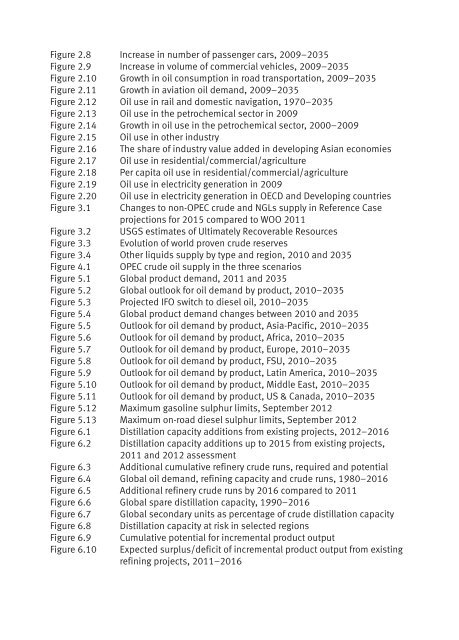
Figure 2.8 Increase in number of passenger cars, 2009–2035<br />
Figure 2.9 Increase in volume of commercial vehicles, 2009–2035<br />
Figure 2.10 Growth in oil consumption in road transportation, 2009–2035<br />
Figure 2.11 Growth in aviation oil demand, 2009–2035<br />
Figure 2.12 <strong>Oil</strong> use in rail and domestic navigation, 1970–2035<br />
Figure 2.13 <strong>Oil</strong> use in the petrochemical sector in 2009<br />
Figure 2.14 Growth in oil use in the petrochemical sector, 2000–2009<br />
Figure 2.15 <strong>Oil</strong> use in other industry<br />
Figure 2.16 The share of industry value added in developing Asian economies<br />
Figure 2.17 <strong>Oil</strong> use in residential/commercial/agriculture<br />
Figure 2.18 Per capita oil use in residential/commercial/agriculture<br />
Figure 2.19 <strong>Oil</strong> use in electricity generation in 2009<br />
Figure 2.20 <strong>Oil</strong> use in electricity generation in OECD and Developing countries<br />
Figure 3.1 Changes to non-OPEC crude and NGLs supply in Reference Case<br />
projections for 2015 compared to WOO 2011<br />
Figure 3.2 USGS estimates of Ultimately Recoverable Resources<br />
Figure 3.3 Evolution of world proven crude reserves<br />
Figure 3.4 Other liquids supply by type and region, 2010 and 2035<br />
Figure 4.1 OPEC crude oil supply in the three scenarios<br />
Figure 5.1 Global product demand, 2011 and 2035<br />
Figure 5.2 Global outlook for oil demand by product, 2010–2035<br />
Figure 5.3 Projected IFO switch to diesel oil, 2010–2035<br />
Figure 5.4 Global product demand changes between 2010 and 2035<br />
Figure 5.5 <strong>Outlook</strong> for oil demand by product, Asia-Pacific, 2010–2035<br />
Figure 5.6 <strong>Outlook</strong> for oil demand by product, Africa, 2010–2035<br />
Figure 5.7 <strong>Outlook</strong> for oil demand by product, Europe, 2010–2035<br />
Figure 5.8 <strong>Outlook</strong> for oil demand by product, FSU, 2010–2035<br />
Figure 5.9 <strong>Outlook</strong> for oil demand by product, Latin America, 2010–2035<br />
Figure 5.10 <strong>Outlook</strong> for oil demand by product, Middle East, 2010–2035<br />
Figure 5.11 <strong>Outlook</strong> for oil demand by product, US & Canada, 2010–2035<br />
Figure 5.12 Maximum gasoline sulphur limits, September 2012<br />
Figure 5.13 Maximum on-road diesel sulphur limits, September 2012<br />
Figure 6.1 Distillation capacity additions from existing projects, 2012–2016<br />
Figure 6.2 Distillation capacity additions up to 2015 from existing projects,<br />
2011 and 2012 assessment<br />
Figure 6.3 Additional cumulative refinery crude runs, required and potential<br />
Figure 6.4 Global oil demand, refining capacity and crude runs, 1980–2016<br />
Figure 6.5 Additional refinery crude runs by 2016 compared to 2011<br />
Figure 6.6 Global spare distillation capacity, 1990–2016<br />
Figure 6.7 Global secondary units as percentage of crude distillation capacity<br />
Figure 6.8 Distillation capacity at risk in selected regions<br />
Figure 6.9 Cumulative potential for incremental product output<br />
Figure 6.10 Expected surplus/deficit of incremental product output from existing<br />
refining projects, 2011–2016


