- Page 3 and 4:
World Oil Outlook 2012 Organization
- Page 5 and 6:
OPEC is a permanent, intergovernmen
- Page 7 and 8:
Contents Foreword 1 Executive summa
- Page 9 and 10:
Section Two Oil downstream outlook
- Page 11 and 12:
Table 2.16 Growth in oil demand in
- Page 13 and 14:
Figure 2.8 Increase in number of pa
- Page 16 and 17:
Foreword
- Page 18 and 19:
2 It should be stressed, however, t
- Page 20 and 21:
4 with all stakeholders aimed at fo
- Page 22 and 23:
Executive summary
- Page 24 and 25:
e 6.3 6.1 8 that year. The impact i
- Page 26 and 27:
10 Total shale gas production in th
- Page 28 and 29:
12 Demand for OPEC crude stays esse
- Page 30 and 31:
14 6 4 2 OPEC Non-crude Non-OPEC No
- Page 32 and 33:
16 3 2 1 0 -1 almost 5 mb/d and mor
- Page 34 and 35:
6.2 6.3 .1 1,100 18 1,000 2.6 mb/d,
- Page 36 and 37:
20 energy sector. At that time many
- Page 38 and 39:
Section One
- Page 41 and 42:
Chapter 1 World oil trends: overvie
- Page 43 and 44:
Box 1.1 Regulatory reform: swap der
- Page 45 and 46:
of swaps, as well as a complete aud
- Page 47 and 48:
Medium-term economic growth This WO
- Page 49 and 50:
Domestic Product (GDP), Italy and S
- Page 51 and 52:
Figure 2 Exports from China to the
- Page 53 and 54:
which average global fertility decl
- Page 55 and 56:
India Nigeria gional increase conti
- Page 57 and 58:
Figure 1.6 Figure 1.6 Real GDP by r
- Page 59 and 60:
By 2035, the Chinese economy will b
- Page 61 and 62:
imported technologies. Trends in TF
- Page 63 and 64:
Figure 1.8 World supply of primary
- Page 65 and 66:
Figure 1.10 Coal: proven reserves a
- Page 67 and 68:
to accelerate, averaging more than
- Page 69 and 70:
Figure 1.15 Evolution of energy dem
- Page 71 and 72:
• The Reference Case assumes high
- Page 73 and 74:
• New policies since WOO 2011, sp
- Page 75 and 76:
Figure 1.20 OECD and non-OECD oil d
- Page 77 and 78:
Figure 1.24 Average annual global g
- Page 79 and 80:
Figure 1.26 Proven oil reserves at
- Page 81 and 82:
Table 1.7. 7 The growth in non-OPEC
- Page 83 and 84:
The total increase of non-crude liq
- Page 85 and 86:
Figure 1.30 Incremental OPEC and no
- Page 87 and 88:
1970 1975 1980 1985 1990 1995 2000
- Page 89:
2 0 Figure 1.36 Per capita CO2 emis
- Page 92 and 93:
76 Figure 2.1 Percentage shares of
- Page 94 and 95:
78 870 million cars across the glob
- Page 96 and 97:
80 Table 2.1 (continued) Vehicle an
- Page 98 and 99:
82 Figure 2.7 Figure 2.7 Passenger
- Page 100 and 101:
84 Commercial vehicles The projecti
- Page 102 and 103:
86 In terms of the ICE vehicle effi
- Page 104 and 105:
88 a key question concerns the exte
- Page 106 and 107:
90 Table 2.5 Oil demand in road tra
- Page 108 and 109:
92 Oil demand growth in this sector
- Page 110 and 111:
94 300 200 2,000 Developing countri
- Page 112 and 113:
96 particularly due to the movement
- Page 114 and 115:
98 China 0 0.1 0.2 0.3 0.4 0.5 mboe
- Page 116 and 117:
100 Table 2.14 Growth in oil demand
- Page 118 and 119:
102 Table 2.15 Oil demand in other
- Page 120 and 121:
104 developing countries, by 2009 i
- Page 122 and 123:
106 this sector was in these countr
- Page 124 and 125:
108 Table 2.19 Oil demand in electr
- Page 126 and 127:
110 Figure 3.1 Changes to non-OPEC
- Page 128 and 129:
112 I), Russkoye (Yamal-Nenets), Su
- Page 130 and 131:
114 Table 3.1 Non-OPEC crude oil an
- Page 132 and 133:
116 The medium-term Reference Case
- Page 134 and 135:
118 Table 3.4 Estimates of world cr
- Page 136 and 137:
120 oil resources, particularly giv
- Page 138 and 139:
122 further indication of the large
- Page 140 and 141:
124 Figure 3.3 Table 3.6 billion ba
- Page 142 and 143:
126 The Reference Case sees biofuel
- Page 144 and 145:
128 much OPEC oil will be needed) g
- Page 146 and 147:
130 Table 4.1 Oil demand in the LEG
- Page 148 and 149:
132 considerably swifter than in th
- Page 150 and 151:
134 24 2000 2005 2010 2015 2020 202
- Page 152 and 153: 136 The improved acquisition, treat
- Page 154 and 155: 138 While access to electricity for
- Page 156 and 157: 140 In September 2012, OPEC and Rus
- Page 158 and 159: Section Two
- Page 161 and 162: Chapter 5 Demand outlook to 2035 Re
- Page 163 and 164: Figure 5.1 Figure 5.1 Global produc
- Page 165 and 166: Figure 5.3 presents the details of
- Page 167 and 168: At first glance, retrofitting scrub
- Page 169 and 170: Moreover, as already underscored, p
- Page 171 and 172: Regional product demand to 2035 Tur
- Page 173 and 174: e el el* cts** 0 8 mb/d of addition
- Page 175 and 176: Figure 5.7 Figure 5.7 Outlook for o
- Page 177 and 178: The increases already highlighted a
- Page 179 and 180: Demand for fuel oil will remain rel
- Page 181 and 182: Shell Chemicals and Formosa Plastic
- Page 183 and 184: equirement of 10 ppm. China is expe
- Page 185 and 186: observed in several countries since
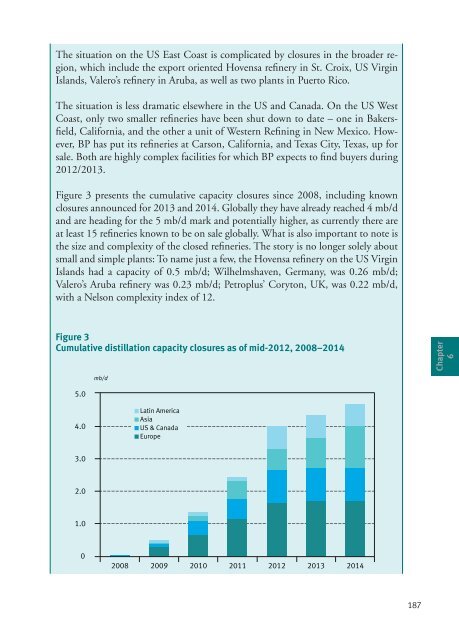
- Page 187 and 188: Germany, provide tax incentives for
- Page 189 and 190: Chapter 6 Medium-term refining outl
- Page 191 and 192: Figure 6.1 Distillation capacity ad
- Page 193 and 194: expansion, however, remains to be s
- Page 195 and 196: Russia and other FSU countries Refi
- Page 197 and 198: Europe For the next few years, refi
- Page 199 and 200: came onstream during 2011, combined
- Page 201: Box figure 1 Figure 1 Estimated dis
- Page 205 and 206: exceed the incremental ‘call on
- Page 207 and 208: -1 2012 2013 2014 2015 2016 Figure
- Page 209 and 210: Figure 6.7 Global secondary units a
- Page 211 and 212: The situation in Europe is differen
- Page 213 and 214: fuels mandates call for the continu
- Page 215 and 216: costly and have shorter lead times.
- Page 217 and 218: 80 70 with 60 1.3 mb/d globally. Th
- Page 219 and 220: One implication of this is that reg
- Page 221 and 222: Chapter 7 Long-term refining outloo
- Page 223 and 224: Table 7.1 Global demand growth and
- Page 225 and 226: Europe lose 5.5 mb/d of throughput
- Page 227 and 228: Figure 7.2 Figure 7.2 Total gasolin
- Page 229 and 230: 2035. As a result, crude throughput
- Page 231 and 232: Table 7.3 Global capacity requireme
- Page 233 and 234: 0 US & Canada Latin America Africa
- Page 235 and 236: 5 of the refining base and demand,
- Page 237 and 238: Chapter 8 Downstream investment req
- Page 239 and 240: Other Asia, in the long-term, the p
- Page 241 and 242: Figure 8.3 also summarizes total in
- Page 243 and 244: Chapter 9 Oil movements Generally,
- Page 245 and 246: 60 Figure 9.1 In summary, the combi
- Page 247 and 248: cant decline in US crude imports -
- Page 249 and 250: The Seaway line used to flow north
- Page 251 and 252: Ford crude east along the Gulf and
- Page 253 and 254:
20 16 2011 2020 2035 For the Asia-P
- Page 255 and 256:
Figure 9.7 in these two regions. Th
- Page 257 and 258:
Chapter 10 Downstream challenges Th
- Page 259 and 260:
Shale gas developments could change
- Page 261 and 262:
Upgrading At around 18 mb/d install
- Page 263 and 264:
conversion. Advances have been made
- Page 265 and 266:
Section One 1. The OPEC Reference B
- Page 267 and 268:
Section Two 1. The World Oil Refini
- Page 269:
Abbreviations
- Page 272 and 273:
256 G-20 Group of Twenty GDP Gross
- Page 274 and 275:
Annex B
- Page 277 and 278:
OECD OECD America Canada Puerto Ric
- Page 279 and 280:
Côte d’Ivoire Rwanda Democratic
- Page 281 and 282:
Gibraltar Turkmenistan Kazakhstan U
- Page 283:
World Oil Refining Logistics and De
- Page 286 and 287:
270 Bolivia (Plurinational State of
- Page 288 and 289:
272 Eastern Europe Albania Poland B
- Page 290 and 291:
Annex D
- Page 292 and 293:
276
- Page 294 and 295:
278 EnSys Energy & Systems, Inc Eur
- Page 296 and 297:
280 Petroleum Economist PFC Energy
- Page 298:
Organization of the Petroleum Expor