

Demographic and Health Survey 2009-10 - Timor-Leste Ministry of ...
Demographic and Health Survey 2009-10 - Timor-Leste Ministry of ...
Demographic and Health Survey 2009-10 - Timor-Leste Ministry of ...

You also want an ePaper? Increase the reach of your titles
YUMPU automatically turns print PDFs into web optimized ePapers that Google loves.
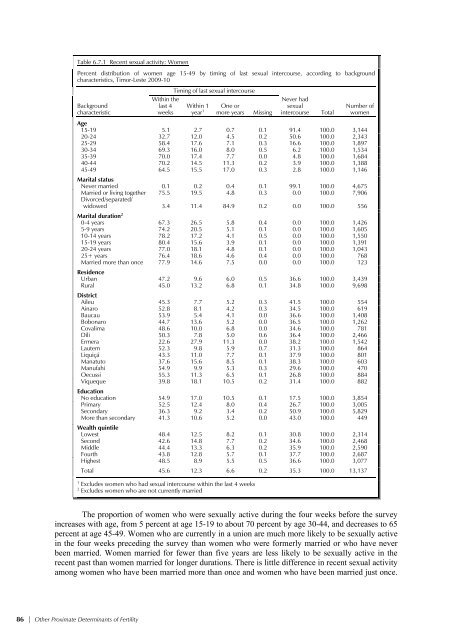
Table 6.7.1 Recent sexual activity: Women<br />
Percent distribution <strong>of</strong> women age 15-49 by timing <strong>of</strong> last sexual intercourse, according to background<br />
characteristics, <strong>Timor</strong>-<strong>Leste</strong> <strong>2009</strong>-<strong>10</strong><br />
Background<br />
characteristic<br />
86 | Other Proximate Determinants <strong>of</strong> Fertility<br />
Within the<br />
last 4<br />
weeks<br />
Timing <strong>of</strong> last sexual intercourse<br />
Within 1<br />
year 1<br />
One or<br />
more years Missing<br />
Never had<br />
sexual<br />
intercourse Total<br />
Number <strong>of</strong><br />
women<br />
Age<br />
15-19 5.1 2.7 0.7 0.1 91.4 <strong>10</strong>0.0 3,144<br />
20-24 32.7 12.0 4.5 0.2 50.6 <strong>10</strong>0.0 2,343<br />
25-29 58.4 17.6 7.1 0.3 16.6 <strong>10</strong>0.0 1,897<br />
30-34 69.3 16.0 8.0 0.5 6.2 <strong>10</strong>0.0 1,534<br />
35-39 70.0 17.4 7.7 0.0 4.8 <strong>10</strong>0.0 1,684<br />
40-44 70.2 14.5 11.3 0.2 3.9 <strong>10</strong>0.0 1,388<br />
45-49<br />
Marital status<br />
64.5 15.5 17.0 0.3 2.8 <strong>10</strong>0.0 1,146<br />
Never married 0.1 0.2 0.4 0.1 99.1 <strong>10</strong>0.0 4,675<br />
Married or living together<br />
Divorced/separated/<br />
75.5 19.5 4.8 0.3 0.0 <strong>10</strong>0.0 7,906<br />
widowed<br />
Marital duration<br />
3.4 11.4 84.9 0.2 0.0 <strong>10</strong>0.0 556<br />
2<br />
0-4 years 67.3 26.5 5.8 0.4 0.0 <strong>10</strong>0.0 1,426<br />
5-9 years 74.2 20.5 5.1 0.1 0.0 <strong>10</strong>0.0 1,605<br />
<strong>10</strong>-14 years 78.2 17.2 4.1 0.5 0.0 <strong>10</strong>0.0 1,550<br />
15-19 years 80.4 15.6 3.9 0.1 0.0 <strong>10</strong>0.0 1,391<br />
20-24 years 77.0 18.1 4.8 0.1 0.0 <strong>10</strong>0.0 1,043<br />
25+ years 76.4 18.6 4.6 0.4 0.0 <strong>10</strong>0.0 768<br />
Married more than once<br />
Residence<br />
77.9 14.6 7.5 0.0 0.0 <strong>10</strong>0.0 123<br />
Urban 47.2 9.6 6.0 0.5 36.6 <strong>10</strong>0.0 3,439<br />
Rural<br />
District<br />
45.0 13.2 6.8 0.1 34.8 <strong>10</strong>0.0 9,698<br />
Aileu 45.3 7.7 5.2 0.3 41.5 <strong>10</strong>0.0 554<br />
Ainaro 52.8 8.1 4.2 0.3 34.5 <strong>10</strong>0.0 619<br />
Baucau 53.9 5.4 4.1 0.0 36.6 <strong>10</strong>0.0 1,408<br />
Bobonaro 44.7 13.6 5.2 0.0 36.5 <strong>10</strong>0.0 1,262<br />
Covalima 48.6 <strong>10</strong>.0 6.8 0.0 34.6 <strong>10</strong>0.0 781<br />
Dili 50.3 7.8 5.0 0.6 36.4 <strong>10</strong>0.0 2,466<br />
Ermera 22.6 27.9 11.3 0.0 38.2 <strong>10</strong>0.0 1,542<br />
Lautem 52.3 9.8 5.9 0.7 31.3 <strong>10</strong>0.0 864<br />
Liquiçá 43.3 11.0 7.7 0.1 37.9 <strong>10</strong>0.0 801<br />
Manatuto 37.6 15.6 8.5 0.1 38.3 <strong>10</strong>0.0 603<br />
Manufahi 54.9 9.9 5.3 0.3 29.6 <strong>10</strong>0.0 470<br />
Oecussi 55.3 11.3 6.5 0.1 26.8 <strong>10</strong>0.0 884<br />
Viqueque<br />
Education<br />
39.8 18.1 <strong>10</strong>.5 0.2 31.4 <strong>10</strong>0.0 882<br />
No education 54.9 17.0 <strong>10</strong>.5 0.1 17.5 <strong>10</strong>0.0 3,854<br />
Primary 52.5 12.4 8.0 0.4 26.7 <strong>10</strong>0.0 3,005<br />
Secondary 36.3 9.2 3.4 0.2 50.9 <strong>10</strong>0.0 5,829<br />
More than secondary<br />
Wealth quintile<br />
41.3 <strong>10</strong>.6 5.2 0.0 43.0 <strong>10</strong>0.0 449<br />
Lowest 48.4 12.5 8.2 0.1 30.8 <strong>10</strong>0.0 2,314<br />
Second 42.6 14.8 7.7 0.2 34.6 <strong>10</strong>0.0 2,468<br />
Middle 44.4 13.3 6.3 0.2 35.9 <strong>10</strong>0.0 2,590<br />
Fourth 43.8 12.8 5.7 0.1 37.7 <strong>10</strong>0.0 2,687<br />
Highest 48.5 8.9 5.5 0.5 36.6 <strong>10</strong>0.0 3,077<br />
Total 45.6 12.3 6.6 0.2 35.3 <strong>10</strong>0.0 13,137<br />
1 Excludes women who had sexual intercourse within the last 4 weeks<br />
2 Excludes women who are not currently married<br />
The proportion <strong>of</strong> women who were sexually active during the four weeks before the survey<br />
increases with age, from 5 percent at age 15-19 to about 70 percent by age 30-44, <strong>and</strong> decreases to 65<br />
percent at age 45-49. Women who are currently in a union are much more likely to be sexually active<br />
in the four weeks preceding the survey than women who were formerly married or who have never<br />
been married. Women married for fewer than five years are less likely to be sexually active in the<br />
recent past than women married for longer durations. There is little difference in recent sexual activity<br />
among women who have been married more than once <strong>and</strong> women who have been married just once.


