- Page 1 and 2:
Timor-Leste Demographic and Health
- Page 3 and 4:
CONTENTS TABLES AND FIGURES .......
- Page 5 and 6:
CHAPTER 7 FERTILITY PREFERENCES 7.1
- Page 7:
14.8 HIV/AIDS-related Knowledge and
- Page 10 and 11:
x | Tables and Figures CHAPTER 4 FE
- Page 12 and 13:
xii | Tables and Figures Table 11.4
- Page 14 and 15:
xiv | Tables and Figures Table 16.4
- Page 17:
FOREWORD The 2009-10 Timor-Leste De
- Page 21:
CONTRIBUTORS TO THE REPORT Elias do
- Page 24 and 25:
about three children more than wome
- Page 26 and 27:
Postnatal Care. The majority of wom
- Page 28 and 29:
However, the level of chronic energ
- Page 31 and 32:
MILLENNIUM DEVELOPMENT GOAL INDICAT
- Page 33 and 34:
INTRODUCTION 1 1.1 HISTORY, GEOGRAP
- Page 35 and 36:
The government of Timor-Leste has l
- Page 37 and 38:
1.5 ORGANIZATION OF THE SURVEY The
- Page 39 and 40:
1.8 HEMOGLOBIN TESTING In one-third
- Page 41:
In these households, 13,796 women w
- Page 44 and 45:
Table 2.1 Household population by a
- Page 46 and 47:
The percentage of children not livi
- Page 48 and 49:
The Early Childhood Care and Educat
- Page 50 and 51:
Table 2.4.2 Educational attainment
- Page 52 and 53:
The GAR at the primary school level
- Page 54 and 55:
ate (2 percent) than their rural co
- Page 56 and 57:
water. Thirty-six percent of househ
- Page 58 and 59:
The type of flooring material used
- Page 60 and 61:
Table 2.11 Wealth quintiles Percent
- Page 63 and 64:
CHARACTERISTICS OF RESPONDENTS 3 Th
- Page 65 and 66:
Table 3.2.1 Educational attainment:
- Page 67 and 68:
Table 3.3.1 Literacy: Women Percent
- Page 69 and 70:
Table 3.4.1 Exposure to mass media:
- Page 71 and 72:
Table 3.5.1 Employment status: Wome
- Page 73 and 74:
3.4.2 Occupation Respondents who we
- Page 75 and 76:
3.4.3 Earnings, Employers, and Cont
- Page 77 and 78:
Tables 3.8.1 and 3.8.2 show the per
- Page 79 and 80:
Table 3.9.1 Use of tobacco: Women P
- Page 81 and 82:
FERTILITY 4 One of the major object
- Page 83 and 84:
Table 4.2 Fertility by background c
- Page 85 and 86:
calculated in the 2003 DHS follows
- Page 87 and 88:
of primary sterility. In Timor-Lest
- Page 89 and 90:
Table 4.8 Median age at first birth
- Page 91 and 92:
FAMILY PLANNING 5 In 2002, the Coun
- Page 93 and 94:
According to the 2003 DHS, knowledg
- Page 95 and 96:
Table 5.3.1 Ever use of contracepti
- Page 97 and 98:
Table 5.4 Current use of contracept
- Page 99 and 100:
Table 5.5 Current use of contracept
- Page 101 and 102:
Use increases with parity but with
- Page 103 and 104:
Female and male sterilizations are
- Page 105 and 106:
Table 5.10 Future use of contracept
- Page 107 and 108:
Table 5.13 Exposure to family plann
- Page 109:
Table 5.15 Husband/partner’s know
- Page 112 and 113:
6.2 POLYGYNY Polygyny (the practice
- Page 114 and 115:
20.9 years. Although the proportion
- Page 116 and 117:
84 | Other Proximate Determinants o
- Page 118 and 119:
Table 6.7.1 Recent sexual activity:
- Page 120 and 121:
There is little difference in the p
- Page 122 and 123:
2 percent among women age 30-34 to
- Page 124 and 125:
92 | Fertility Preferences Table 7.
- Page 126 and 127:
94 | Fertility Preferences 7.3 NEED
- Page 128 and 129:
96 | Fertility Preferences an idea
- Page 130 and 131:
98 | Fertility Preferences The perc
- Page 132 and 133:
with their death, or they may live
- Page 134 and 135:
100 80 60 40 20 102 | Infant and Ch
- Page 136 and 137:
104 | Infant and Child Mortality Ta
- Page 138 and 139:
8.7 HIGH-RISK FERTILITY BEHAVIOR Th
- Page 141 and 142:
ADULT AND MATERNAL MORTALITY 9 The
- Page 143 and 144:
9.2 ADULT MORTALITY Table 9.3 Sibsh
- Page 145 and 146:
MATERNAL HEALTH 10 Making Pregnancy
- Page 147 and 148:
among women in the lowest wealth qu
- Page 149 and 150:
A much lower percentage of Timorese
- Page 151 and 152:
Table 10.5 Knowledge of danger sign
- Page 153 and 154:
10.6.2 Assistance during Delivery O
- Page 155 and 156:
Table 10.8 Knowledge of danger sign
- Page 157 and 158:
Table 10.10 Application of material
- Page 159 and 160:
Table 10.12 Timing of first postnat
- Page 161 and 162:
Where health services are present,
- Page 163 and 164:
CHILD HEALTH 11 This chapter presen
- Page 165 and 166:
In the TLDHS, information on vaccin
- Page 167 and 168:
Boys (54 percent) are somewhat more
- Page 169 and 170:
The data indicate that two percent
- Page 171 and 172:
11.6 DIARRHEAL DISEASE Dehydration
- Page 173 and 174:
Table 11.8 Diarrhea treatment Among
- Page 175 and 176:
Ten percent of children with diarrh
- Page 177:
There are marked differences in the
- Page 180 and 181:
international reference population
- Page 182 and 183:
80 Percent 70 60 50 40 30 20 10 150
- Page 184 and 185:
60 50 40 30 20 10 152 | Nutrition o
- Page 186 and 187:
Table 12.2 shows the percentages of
- Page 188 and 189:
100 Percent 90 80 70 60 50 40 30 20
- Page 190 and 191:
Table 12.5 Foods and liquids consum
- Page 192 and 193:
Table 12.6 Infant and young child f
- Page 194 and 195:
Table 12.7 shows the percentage of
- Page 196 and 197:
the most recent distribution preced
- Page 198 and 199:
Table 12.10 Nutritional status of w
- Page 200 and 201:
Table 12.12 shows data on micronutr
- Page 202 and 203:
12.12 PREVALENCE OF ANEMIA IN WOMEN
- Page 205 and 206:
MALARIA 13 Malaria remains a leadin
- Page 207 and 208:
13.1.2 Use of Mosquito Nets by Chil
- Page 209 and 210:
Tables 13.3 and 13.4 show the perce
- Page 211 and 212:
The highest prevalence of fever is
- Page 213 and 214:
HIV/AIDS-RELATED KNOWLEDGE, ATTITUD
- Page 215 and 216:
percent of women and 61 percent of
- Page 217 and 218:
person who has AIDS or by sharing c
- Page 219 and 220:
Comprehensive knowledge about AIDS
- Page 221 and 222:
HIV or AIDS on all four indicators
- Page 223 and 224:
Table 14.6 Payment for sexual inter
- Page 225 and 226:
14.5 MALE CIRCUMCISION Male circumc
- Page 227 and 228:
In the 2009-10 TLDHS, women and men
- Page 229 and 230:
100 Percent 80 60 40 20 0 64 Total
- Page 231 and 232:
14.8.2 Age at First Sex and Condom
- Page 233 and 234:
To assess the extent of condom use
- Page 235 and 236:
WOMEN’S EMPOWERMENT AND DEMOGRAPH
- Page 237 and 238:
Table 15.2.1 Control over women’s
- Page 239 and 240:
Table 15.2.2 Control over men's cas
- Page 241 and 242:
Table 15.4.1 Women’s participatio
- Page 243 and 244:
Table 15.5.1 Women’s participatio
- Page 245 and 246:
15.5 ATTITUDES TOWARD WIFE BEATING
- Page 247 and 248: Table 15.6.2 Attitude toward wife b
- Page 249 and 250: Table 15.7.1 Attitude toward refusi
- Page 251 and 252: Women’s empowerment is closely as
- Page 253 and 254: Table 15.8 Indicators of women’s
- Page 255 and 256: pathways: its negative association
- Page 257 and 258: DOMESTIC VIOLENCE 16 In the words o
- Page 259 and 260: partner] hit, slapped, kicked, or d
- Page 261 and 262: Table 16.1 Experience of physical v
- Page 263 and 264: Among women who have never been mar
- Page 265 and 266: who experienced sexual violence fir
- Page 267 and 268: Domestic violence is not limited to
- Page 269 and 270: Table 16.8 Forms of spousal violenc
- Page 271 and 272: Table 16.9—Continued Emotional vi
- Page 273 and 274: Table 16.10 Spousal violence by hus
- Page 275 and 276: 16.14 Physical Violence by Women ag
- Page 277 and 278: 16.15 HELP-SEEKING BEHAVIOR OF WOME
- Page 279 and 280: 16.17 SOCIAL NORMS AND VALUES The f
- Page 281 and 282: REFERENCES Acharya, M. 2010. Effort
- Page 283 and 284: Ministry of Health (MOH) [Timor-Les
- Page 285: World Health Organization (WHO), Wo
- Page 288 and 289: 256 | Appendix A during the populat
- Page 290 and 291: A.5 SURVEY RESULTS 258 | Appendix A
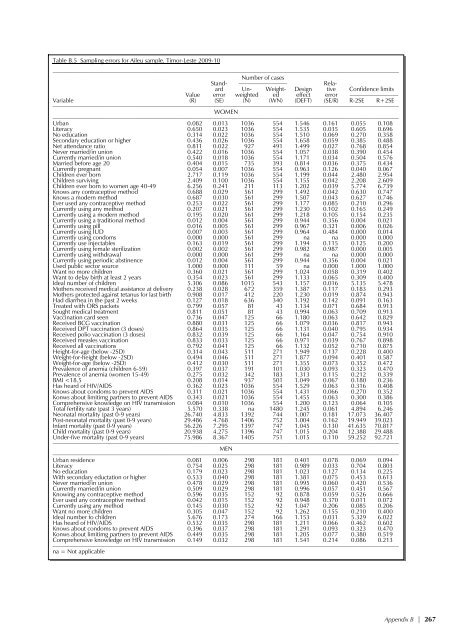
- Page 293 and 294: ESTIMATES OF SAMPLING ERRORS Append
- Page 295 and 296: Table B.1 List of selected variable
- Page 297: Table B.3 Sampling errors for Urban
- Page 301 and 302: Table B.7 Sampling errors for Bauca
- Page 303 and 304: Table B.9 Sampling errors for Coval
- Page 305 and 306: Table B.11 Sampling errors for Erme
- Page 307 and 308: Table B.13 Sampling errors for Liqu
- Page 309 and 310: Table B.15 Sampling errors for Manu
- Page 311: Table B.17 Sampling errors for Viqu
- Page 314 and 315: 282 | Appendix C Table C.2.1 Age di
- Page 316 and 317: 284 | Appendix C Table C.5 Reportin
- Page 318 and 319: 286 | Appendix C Table C.7 Nutritio
- Page 321 and 322: PERSONS INVOLVED IN THE 2009-10 TIM
- Page 323 and 324: Martinho da Costa Cesaltina Falcao
- Page 325: QUESTIONNAIRES Appendix E Appendix
- Page 328 and 329: 296 | Appendix E Introduction and C
- Page 330 and 331: IF AGE 15 IF AGE 0-17 YEARS IF AGE
- Page 332 and 333: 300 | Appendix E HOUSEHOLD CHARACTE
- Page 334 and 335: 302 | Appendix E NO. QUESTIONS AND
- Page 336 and 337: 304 | Appendix E NO. QUESTIONS AND
- Page 338 and 339: 306 | Appendix E WEIGHT, HEIGHT AND
- Page 340 and 341: 308 | Appendix E WEIGHT, HEIGHT, AN
- Page 342 and 343: 310 | Appendix E
- Page 344 and 345: 312 | Appendix E INTRODUCTION AND C
- Page 346 and 347: 314 | Appendix E SECTION 2. REPRODU
- Page 348 and 349:
212 316 | Appendix E 213 214 215 21
- Page 350 and 351:
318 | Appendix E NO. QUESTIONS AND
- Page 352 and 353:
320 | Appendix E NO. QUESTIONS AND
- Page 354 and 355:
322 | Appendix E NO. QUESTIONS AND
- Page 356 and 357:
324 | Appendix E NO. QUESTIONS AND
- Page 358 and 359:
326 | Appendix E LAST BIRTH NEXT-TO
- Page 360 and 361:
328 | Appendix E LAST BIRTH NEXT-TO
- Page 362 and 363:
330 | Appendix E LAST BIRTH NEXT-TO
- Page 364 and 365:
332 | Appendix E LAST BIRTH NEXT-TO
- Page 366 and 367:
334 | Appendix E LAST BIRTH NEXT-TO
- Page 368 and 369:
336 | Appendix E LAST BIRTH NEXT-TO
- Page 370 and 371:
338 | Appendix E LAST BIRTH NEXT-TO
- Page 372 and 373:
340 | Appendix E LAST BIRTH NEXT-TO
- Page 374 and 375:
342 | Appendix E LAST BIRTH NEXT-TO
- Page 376 and 377:
344 | Appendix E LAST BIRTH NEXT-TO
- Page 378 and 379:
346 | Appendix E NO. QUESTIONS AND
- Page 380 and 381:
348 | Appendix E NO. QUESTIONS AND
- Page 382 and 383:
350 | Appendix E LAST SEXUAL PARTNE
- Page 384 and 385:
352 | Appendix E SECTION 7. FERTILI
- Page 386 and 387:
354 | Appendix E NO. QUESTIONS AND
- Page 388 and 389:
356 | Appendix E SECTION 8. HUSBAND
- Page 390 and 391:
358 | Appendix E NO. QUESTIONS AND
- Page 392 and 393:
360 | Appendix E NO. QUESTIONS AND
- Page 394 and 395:
362 | Appendix E SECTION 10. OTHER
- Page 396 and 397:
364 | Appendix E SECTION 11. MATERN
- Page 398 and 399:
366 | Appendix E SECTION 12. DOMEST
- Page 400 and 401:
368 | Appendix E NO. QUESTIONS AND
- Page 402 and 403:
370 | Appendix E NO. QUESTIONS AND
- Page 404 and 405:
372 | Appendix E INSTRUCTIONS: 2 04
- Page 406 and 407:
374 | Appendix E INTRODUCTION AND C
- Page 408 and 409:
376 | Appendix E SECTION 2. REPRODU
- Page 410 and 411:
378 | Appendix E SECTION 3. CONTRAC
- Page 412 and 413:
380 | Appendix E 311 Where is that?
- Page 414 and 415:
382 | Appendix E NO. QUESTIONS AND
- Page 416 and 417:
384 | Appendix E NO. QUESTIONS AND
- Page 418 and 419:
386 | Appendix E SECTION 5. FERTILI
- Page 420 and 421:
388 | Appendix E SECTION 6. EMPLOYM
- Page 422 and 423:
390 | Appendix E SECTION 7. HIV/AID
- Page 424 and 425:
392 | Appendix E NO. QUESTIONS AND
- Page 426 and 427:
394 | Appendix E NO. QUESTIONS AND