- Page 2 and 3:
Copyright © 2007by the United Nati
- Page 4:
ForewordWhat we do today about clim
- Page 7 and 8:
AcknowledgementsThis Report could n
- Page 9 and 10:
Jean-Robert Moret, Koos Neefjes, Ii
- Page 11 and 12:
From climate shocks today to depriv
- Page 13 and 14:
Figures1.1 Rising CO 2emissions are
- Page 15 and 16:
… while preserving it for future
- Page 17 and 18:
Climate change providesa potent rem
- Page 19 and 20:
The real choice facingpolitical lea
- Page 21 and 22:
The world’s poor andfuture genera
- Page 23 and 24:
Current investment patternsare putt
- Page 25 and 26:
Avoiding the unprecedentedthreats p
- Page 27 and 28:
The rapid development anddeployment
- Page 29 and 30:
Support for the MDGsprovides anothe
- Page 31 and 32:
For the current generation,the chal
- Page 33 and 34:
• Create a Climate Change Mitigat
- Page 35 and 36:
“One generation plants a tree; th
- Page 37 and 38:
1The 21 st Century climate challeng
- Page 39 and 40:
1The 21 st Century climate challeng
- Page 41 and 42:
1The 21 st Century climate challeng
- Page 43 and 44:
1Special contributionClimate policy
- Page 45 and 46:
1The 21 st Century climate challeng
- Page 47 and 48:
1The 21 st Century climate challeng
- Page 49 and 50:
1The 21 st Century climate challeng
- Page 51 and 52:
1The 21 st Century climate challeng
- Page 53 and 54:
1The 21 st Century climate challeng
- Page 55 and 56:
1 The 21 st Century climate challen
- Page 57 and 58:
1The 21 st Century climate challeng
- Page 59 and 60:
1The 21 st Century climate challeng
- Page 61 and 62:
1The 21 st Century climate challeng
- Page 63 and 64:
1The 21 st Century climate challeng
- Page 65 and 66:
1The 21 st Century climate challeng
- Page 67 and 68:
1The 21 st Century climate challeng
- Page 69 and 70:
1Box 1.3Developed countries have fa
- Page 71 and 72:
1The 21 st Century climate challeng
- Page 73 and 74:
1The 21 st Century climate challeng
- Page 75 and 76:
1The 21 st Century climate challeng
- Page 77 and 78:
1The 21 st Century climate challeng
- Page 79 and 80:
1The 21 st Century climate challeng
- Page 81 and 82:
1The 21 st Century climate challeng
- Page 83 and 84:
1The 21 st Century climate challeng
- Page 86 and 87:
Climate shocks:risk and vulnerabili
- Page 88 and 89:
CHAPTER2Climateshocks: risk andvuln
- Page 90 and 91:
in order to cast a light on future
- Page 92 and 93:
Box 2.1Under-reporting climate disa
- Page 94 and 95:
Box 2.2The global insurance industr
- Page 96 and 97: Box 2.3Hurricane Katrina—the soci
- Page 98 and 99: human rights of the Inuit. The aim
- Page 100 and 101: have been at least 14% lower (table
- Page 102 and 103: intensify these pressures. In Ethio
- Page 104 and 105: unable to build productive assets,
- Page 106 and 107: Climate modelling exercises point t
- Page 108 and 109: Box 2.7Climate change in Malawi—m
- Page 110 and 111: prominently in low human developmen
- Page 112 and 113: Box 2.8Climate change and China’s
- Page 114 and 115: Box 2.9Melting glaciers and retreat
- Page 116 and 117: enign climate change scenarios poin
- Page 118 and 119: Alaska to Siberia has increased by
- Page 120 and 121: donors to invest in rehabilitation.
- Page 122: more likely. Evidence from the past
- Page 125 and 126: “We shall require a substantially
- Page 127 and 128: 3Avoiding dangerous climate change:
- Page 129 and 130: Table 3.1Emission reduction targets
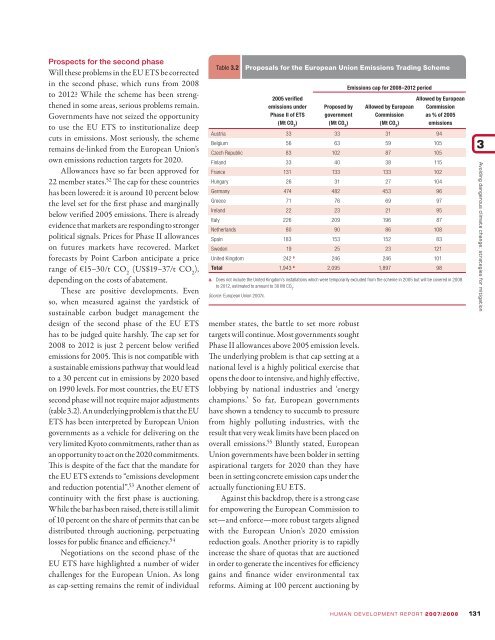
- Page 131 and 132: Box 3.1Leadership by example in car
- Page 133 and 134: 3Avoiding dangerous climate change:
- Page 135 and 136: Box 3.2Targets and outcomes diverge
- Page 137 and 138: Box 3.3The United Kingdom's climate
- Page 139 and 140: Box 3.5Reducing carbon intensity in
- Page 141 and 142: 3Avoiding dangerous climate change:
- Page 143 and 144: 3Avoiding dangerous climate change:
- Page 145: 3Avoiding dangerous climate change:
- Page 149 and 150: 3Avoiding dangerous climate change:
- Page 151 and 152: Box 3.7Renewable energy in Germany
- Page 153 and 154: 3Avoiding dangerous climate change:
- Page 155 and 156: 3Avoiding dangerous climate change:
- Page 157 and 158: 3Avoiding dangerous climate change:
- Page 159 and 160: Box 3.9Palm oil and biofuel develop
- Page 161 and 162: 3Avoiding dangerous climate change:
- Page 163 and 164: 3Avoiding dangerous climate change:
- Page 165 and 166: 3Avoiding dangerous climate change:
- Page 167 and 168: Box 3.11Decarbonizing growth in Ind
- Page 169 and 170: 3Avoiding dangerous climate change:
- Page 171 and 172: 3Avoiding dangerous climate change:
- Page 173 and 174: 3Avoiding dangerous climate change:
- Page 175 and 176: 3Avoiding dangerous climate change:
- Page 178 and 179: 4Adapting to the inevitable:nationa
- Page 180 and 181: CHAPTER4Adapting to the inevitable:
- Page 182 and 183: Mitigation is one part of a twin st
- Page 184 and 185: structures for adaptation planning.
- Page 186 and 187: national climate change projections
- Page 188 and 189: Adjusted for country context, these
- Page 190 and 191: training and support, to 11 regiona
- Page 192 and 193: must take into account the impact o
- Page 194 and 195: Act guarantees 100 days of employme
- Page 196 and 197:
• In Kenya, drought in pastoral a
- Page 198 and 199:
Box 4.5Risk insurance and adaptatio
- Page 200 and 201:
oad umbrella, rich countries are re
- Page 202 and 203:
0.7 percent of Gross National Incom
- Page 204 and 205:
vulnerable ecosystems. Actual spend
- Page 206 and 207:
ange for that risk extends from a n
- Page 208 and 209:
countries. 71 The figures are based
- Page 210 and 211:
adaptation will require a high leve
- Page 212 and 213:
national and subnational programmes
- Page 214 and 215:
NotesChapter 11 Diamond 2005.2 Kenn
- Page 216 and 217:
oceans, which cover 70 percent of t
- Page 218 and 219:
69 Gurría and Manning 2007.70 OCHA
- Page 220 and 221:
Canales Davila, Caridad and Alberto
- Page 222 and 223:
———. 2006a. “Building a Glo
- Page 224 and 225:
EPA (Environment Protection Agency)
- Page 226 and 227:
OECD Development Assistance Committ
- Page 228 and 229:
Landau, J.P. 2004. “Rapport à Mo
- Page 230 and 231:
Regional Hunger and Vulnerability P
- Page 232 and 233:
UNDP (United Nations Development Pr
- Page 236 and 237:
Readers guide and notes to tablesHu
- Page 238 and 239:
sification, which refers only to th
- Page 240 and 241:
Note to Table 1: about this year’
- Page 242 and 243:
ences in national price levels. The
- Page 244 and 245:
TABLE1Monitoringhuman development:
- Page 246 and 247:
TABLE1HDI rank aHumandevelopmentind
- Page 248 and 249:
TABLE1aMonitoring human development
- Page 250 and 251:
TABLE2HDI rank 1975 1980 1985 1990
- Page 252 and 253:
TABLE2HDI rank 1975 1980 1985 1990
- Page 254 and 255:
TABLE3HDI rankHuman povertyindex (H
- Page 256 and 257:
TABLE4Monitoring human development:
- Page 258 and 259:
TABLE5.. . to lead a long and healt
- Page 260 and 261:
TABLE5HDI rankTotal population(mill
- Page 262 and 263:
TABLE6.. . to lead a long and healt
- Page 264 and 265:
TABLE6HDI rankPublic(% of GDP)Healt
- Page 266 and 267:
TABLE7. . . to lead a long and heal
- Page 268 and 269:
TABLE7HDI rankMDGPopulation usingim
- Page 270 and 271:
TABLE8.. . to lead a long and healt
- Page 272 and 273:
TABLE9.. . to lead a long and healt
- Page 274 and 275:
TABLE9HDI rankHIVprevalence a(% age
- Page 276 and 277:
TABLE10.. . to lead a long and heal
- Page 278 and 279:
TABLE10HDI rankLife expectancy at b
- Page 280 and 281:
TABLE11. . . to acquire knowledge .
- Page 282 and 283:
TABLE11Public expenditure on educat
- Page 284 and 285:
TABLE12.. . to acquire knowledge .
- Page 286 and 287:
TABLE12HDI rankAdult literacy rate(
- Page 288 and 289:
TABLE13. . . to acquire knowledge .
- Page 290 and 291:
TABLE13HDI rankMDGTelephone mainlin
- Page 292 and 293:
TABLE14.. . to have access to the r
- Page 294 and 295:
TABLE14HDI rankUS$ billions2005GDPG
- Page 296 and 297:
TABLE15.. . to have access to the r
- Page 298 and 299:
TABLE15HDI rankSurvey yearMDGShare
- Page 300 and 301:
TABLE16.. . to have access to the r
- Page 302 and 303:
TABLE16HDI rankImports of goodsand
- Page 304 and 305:
TABLE17.. . to have access to the r
- Page 306 and 307:
TABLE18HDI rankOfficial development
- Page 308 and 309:
TABLE18HDI rankOfficial development
- Page 310 and 311:
TABLE19HDI rankPublicexpenditureon
- Page 312 and 313:
TABLE19Publicexpenditureon health(%
- Page 314 and 315:
TABLE21.. . to have access to the r
- Page 316 and 317:
TABLE21Unemployedpeople(thousands)E
- Page 318 and 319:
TABLE22HDI rankElectricity consumpt
- Page 320 and 321:
TABLE22Electricity consumptionper c
- Page 322 and 323:
TABLE23Share of TPES aFossil fuels
- Page 324 and 325:
TABLE23Share of TPES aFossil fuels
- Page 326 and 327:
TABLE24HDI rankTotal(Mt CO 2)Annual
- Page 328 and 329:
TABLE24Total(Mt CO 2)Annualchange(%
- Page 330 and 331:
TABLE25HDI rankCartagenaProtocol on
- Page 332 and 333:
TABLE25HDI rankCartagenaProtocol on
- Page 334 and 335:
TABLE26HDI rankInternallydisplacedp
- Page 336 and 337:
TABLE26Conventional arms transfers
- Page 338 and 339:
TABLE27HDI rank2000-04 c 2007 d 200
- Page 340 and 341:
TABLE27HDI rank2000-04 c 2007 d 200
- Page 342 and 343:
TABLE28HDI rankGender-relateddevelo
- Page 344 and 345:
TABLE28Gender-relateddevelopmentind
- Page 346 and 347:
TABLE29HDI rankGender empowerment m
- Page 348 and 349:
TABLE29MDG Female legislators, Fema
- Page 350 and 351:
TABLE30HDI rankAdult literacy aFema
- Page 352 and 353:
TABLE30Adult literacy aMDGYouth lit
- Page 354 and 355:
TABLE31HDI rankFemale economic acti
- Page 356 and 357:
TABLE31HDI rankFemale economic acti
- Page 358 and 359:
TABLE33.. . and achieving equality
- Page 360 and 361:
TABLE33Year women received right aY
- Page 362 and 363:
TABLE34Humanand labour rights instr
- Page 364 and 365:
TABLE34HDI rankInternationalConvent
- Page 366 and 367:
TABLE35Humanand labour rights instr
- Page 368 and 369:
TABLE35HDI rankFreedom of associati
- Page 370 and 371:
TECHNICAL NOTE 1Calculating the hum
- Page 372 and 373:
HUMAN DEVELOPMENT REPORT 2007/2008
- Page 374 and 375:
Calculating the GDI (continued)Seco
- Page 376 and 377:
Selected readingsAnand, Sudhir, and
- Page 378 and 379:
under the age of five countries tha
- Page 380 and 381:
Earned income (PPP US$), estimated
- Page 382 and 383:
individual or household. The Gini i
- Page 384 and 385:
problems of under reporting and mis
- Page 386 and 387:
Unemployment Refers to all people a
- Page 388 and 389:
Statec. 2006. Correspondence on gro
- Page 390 and 391:
Countries in the income aggregatesH
- Page 392 and 393:
Developing countries in the regiona
- Page 394 and 395:
Indicator table Indicator Indicator
- Page 396 and 397:
Indicator table Indicator Indicator
- Page 398 and 399:
Index to Millennium Development Goa