The 21st Century climate challenge
The 21st Century climate challenge
The 21st Century climate challenge

You also want an ePaper? Increase the reach of your titles
YUMPU automatically turns print PDFs into web optimized ePapers that Google loves.
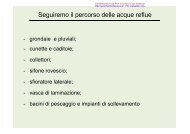
TABLE30Adult literacy aMDGYouth literacy aNet primaryenrolment b, cMDGGross primaryenrolment b, dMDGGross secondaryenrolment b, dMDGGross tertiaryenrolment b, dHDI rankFemalerate(% aged 15and older)1995–2005Ratio offemalerate tomale rate1995–2005Femalerate(% aged15–24)1995–2005Ratio offemalerate tomale rate1995–2005Femalerate(%)2005Ratio offemalerate tomale rate2005Femaleratio(%)2005Ratio offemalerate tomale rate2005Femaleratio(%)2005Ratio offemalerate tomale rate2005Femaleratio(%)2005Ratio offemalerate tomale rate2005160 Guinea 18.1 0.43 33.7 0.57 61 0.87 74 0.84 21 e 0.53 e 1 0.24161 Rwanda 59.8 0.84 76.9 0.98 75 e 1.04 e 121 e 1.02 e 13 e 0.89 e 2 e 0.62 e162 Angola 54.2 0.65 63.2 0.75 .. .. .. .. 15 f 0.78 f 1 e,f 0.66 e,f163 Benin 23.3 0.49 33.2 0.56 70 0.81 85 0.80 23 e 0.57 e 1 e,f 0.25 e,f164 Malawi 54.0 0.72 70.7 0.86 97 1.05 124 1.02 25 0.81 (.) f 0.54 f165 Zambia 59.8 0.78 66.2 0.91 89 1.00 108 0.95 25 e 0.82 e .. ..166 Côte d’Ivoire 38.6 0.63 52.1 0.74 50 e,f 0.80 e,f 63 e,f 0.79 e,f 18 e,f 0.55 e,f .. ..167 Burundi 52.2 0.78 70.4 0.92 58 0.91 78 0.86 11 e 0.74 e 1 e 0.38 e168 Congo (Democratic Republic of the) 54.1 0.67 63.1 0.81 .. .. 54 e,f 0.78 e,f 16 e,f 0.58 e,f .. ..169 Ethiopia 22.8 0.46 38.5 0.62 59 0.92 86 0.86 24 0.65 1 0.32170 Chad 12.8 0.31 23.2 0.42 .. .. 62 0.67 8 e 0.33 e (.) e 0.14 e171 Central African Republic 33.5 0.52 46.9 0.67 .. .. 44 e 0.66 e .. .. .. ..172 Mozambique 25.0 0.46 36.6 0.61 74 0.91 94 0.85 11 0.69 1 0.49173 Mali 15.9 0.49 16.9 0.52 45 0.81 59 0.80 18 e 0.62 e 2 e 0.47 e174 Niger 15.1 0.35 23.2 0.44 33 0.73 39 0.73 7 0.68 1 0.45175 Guinea-Bissau .. .. .. .. 37 e,f 0.71 e,f 56 e,f 0.67 e,f 13 e,f 0.54 e,f (.) e,f 0.18 e,f176 Burkina Faso 16.6 0.53 26.5 0.66 40 0.79 51 0.80 12 0.70 1 0.45177 Sierra Leone 24.2 0.52 37.4 0.63 .. .. 65 f 0.71 f 22 e,f 0.71 e,f 1 e,f 0.40 e,fDeveloping countries 69.9 0.91 81.4 0.91 83 i 0.95 i 104 i 0.94 i 58 i 0.93 i 16 i 0.91 iLeast developed countries 44.3 0.80 58.0 0.80 70 i 0.92 i 90 i 0.89 i 28 i 0.81 i 3 i 0.63 iArab States 59.4 0.88 79.5 0.88 77 i 0.92 i 88 i 0.90 i 65 i 0.92 i 21 i 1.01 iEast Asia and the Pacifi c 86.7 0.99 97.5 0.99 93 i 0.99 i 110 i 0.98 i 72 i 1.00 i 21 i 0.93 iLatin America and the Caribbean 89.7 1.01 97.0 1.01 95 i 1.00 i 115 i 0.96 i 91 i 1.08 i 32 i 1.17 iSouth Asia 47.4 0.81 66.6 0.81 82 i 0.92 i 109 i 0.93 i 48 i 0.83 i 9 i 0.74 iSub-Saharan Africa 51.2 0.84 65.1 0.84 68 i 0.93 i 92 i 0.89 i 28 i 0.79 i 4 i 0.62 iCentral and Eastern Europe and the CIS 98.7 1.00 99.6 1.00 91 i 1.00 i 107 i 0.99 i 90 i 0.98 i 63 i 1.30 iOECD .. .. .. .. 96 i 1.00 i 101 i 0.99 i 98 i 1.00 i 65 i 1.17 iHigh-income OECD .. .. .. .. 96 i 1.01 i 102 i 0.99 i 103 i 1.00 i 76 i 1.20 iHigh human development 93.6 1.01 98.4 1.01 .. .. .. .. .. .. .. ..Medium human development 71.2 0.92 83.2 0.92 .. .. .. .. .. .. .. ..Low human development 43.8 0.80 58.9 0.80 .. .. .. .. .. .. .. ..High income .. .. .. .. 95 i 1.01 i 101 i 0.99 i 102 i 1.00 i 73 i 1.21 iMiddle income 86.5 0.99 96.2 0.99 92 i 0.99 i 110 i 0.97 i 78 i 1.01 i 28 i 1.09 iLow income 48.8 0.82 65.8 0.82 76 i 0.92 i 99 i 0.91 i 41 i 0.82 i 7 i 0.68 iWorld 72.7 0.92 82.5 0.92 85 i 0.96 i 104 i 0.95 i 64 i 0.94 i 25 i 1.05 iNOTESa. Data refer to national literacy estimates fromcensuses or surveys conducted between 1995and 2005, unless otherwise specifi ed. Due todifferences in methodology and timeliness ofunderlying data, comparisons across countriesand over time should be made with caution. Formore details, see http://www.uis.unesco.org/.b. Data for some countries may refer to national orUNESCO Institute for Statistics estimates. Formore details, see http://www.uis.unesco.org/.c. <strong>The</strong> net enrolment rate is the number of pupils ofthe theoretical school-age group for a given levelof education level who are enrolled in that level,expressed as a percentage of the total populationin that age group.d. <strong>The</strong> gross enrolment ratio is the total numberof pupils or students enrolled in a given level ofeducation, regardless of age, expressed as apercentage of the population in the theoreticalage group for the same level of education. For thetertiary level, the population used is the fi ve-yearage group following on from the secondary schoolleaving age. Gross enrolment ratios in excessof 100 indicate that there are pupils or studentsoutside the theoretical age group who are enrolledin that level of education.e. National or UNESCO Institute forStatistics estimate.f. Data refer to an earlier year than that specifi ed.g. UNESCO Institute for Statistics estimate based onits Global Age-specifi c Literacy Projections model,April 2007.h. Data refer to the 2006 school year.i. Data refer to aggregates calculated by UNESCOInstitute for Statistics.SOURCESColumns 1–4: UNESCO Institute forStatistics 2007a.Columns 5–12: UNESCO Institute forStatistics 2007c.Human development indicatorsHUMAN DEVELOPMENT REPORT 2007/2008 337