The 21st Century climate challenge
The 21st Century climate challenge
The 21st Century climate challenge

Create successful ePaper yourself
Turn your PDF publications into a flip-book with our unique Google optimized e-Paper software.
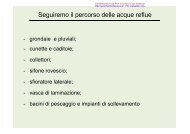
TABLE3 Human and income poverty: developing countriesProbabilityat birthof notsurviving toage 40 a, †(% of cohort)2000–05Adultilliteracyrate b,†(% aged 15and older)1995–2005Populationnot using animprovedwater source †National1990–2005 dHuman poverty(%)index (HPI-1)HDI rankRank (%)20041990–2005 d 1990–2004 dValue(%)$1 a day $2 a day poverty lineLOW HUMAN DEVELOPMENT156 Senegal 97 42.9 17.1 60.7 24 17 17.0 56.2 33.4 28157 Eritrea 76 36.0 24.1 .. f 40 40 .. .. 53.0 ..158 Nigeria 80 37.3 39.0 30.9 h 52 29 70.8 92.4 34.1 -19159 Tanzania (United Republic of) 67 32.5 36.2 30.6 38 22 57.8 89.9 35.7 -22160 Guinea 103 52.3 28.6 70.5 50 26 .. .. 40.0 ..161 Rwanda 78 36.5 44.6 35.1 26 23 60.3 87.8 60.3 -16162 Angola 89 40.3 46.7 32.6 47 31 .. .. .. ..163 Benin 100 47.6 27.9 65.3 33 23 30.9 73.7 29.0 16164 Malawi 79 36.7 44.4 35.9 27 22 20.8 62.9 65.3 11165 Zambia 96 41.8 53.9 32.0 42 20 63.8 87.2 68.0 -7166 Côte d’Ivoire 92 40.3 38.6 51.3 16 17 14.8 48.8 .. 29167 Burundi 81 37.6 38.2 40.7 21 45 54.6 87.6 36.4 -8168 Congo (Democratic Republic of the) 88 39.3 41.1 32.8 54 31 .. .. .. ..169 Ethiopia 105 54.9 33.3 64.1 78 38 23.0 77.8 44.2 27170 Chad 108 56.9 32.9 74.3 58 37 .. .. 64.0 ..171 Central African Republic 98 43.6 46.2 51.4 25 24 66.6 84.0 .. -6172 Mozambique 101 50.6 45.0 61.3 57 24 36.2 74.1 69.4 12173 Mali 107 56.4 30.4 76.0 50 33 36.1 72.1 63.8 18174 Niger 104 54.7 28.7 71.3 54 40 60.6 85.8 63.0 e 1175 Guinea-Bissau 99 44.8 40.5 .. f 41 25 .. .. .. ..176 Burkina Faso 106 55.8 26.5 76.4 39 38 27.2 71.8 46.4 23177 Sierra Leone 102 51.7 45.6 65.2 43 27 57.0 e 74.5 e 70.2 4MDGMDGChildrenPopulation below income poverty lineunder weightfor age †(% underage 5)1996-2005 dHPI-1 rankminusincomepovertyrank cNOTES† Denotes indicators used to calculate the humanpoverty index (HPI-1). For further details, seeTechnical note 1.a. Data refer to the probability at birth of not survivingto age 40, multiplied by 100.b. Data refer to national illiteracy estimates fromcensuses or surveys conducted between 1995and 2005, unless otherwise specifi ed. Due todifferences in methodology and timeliness ofunderlying data, comparisons across countries andover time should be made with caution. For moredetails, see http://www.uis.unesco.org/.c. Income poverty refers to the share of thepopulation living on less than $1 a day. Allcountries with an income poverty rate of less than2% were given equal rank. <strong>The</strong> rankings are basedon countries for which data are available for bothindicators. A positive fi gure indicates that thecountry performs better in income poverty than inhuman poverty, a negative the opposite.d. Data refer to the most recent year available duringthe period specifi ed.e. Data refer to a year or period other than thatspecifi ed, differ from the standard defi nition orrefer to only part of a country.f. In the absence of recent data, estimates fromUNESCO Institute for Statistics 2003 based onoutdated census or survey information, were usedand should be interpreted with caution: Barbados0.3, Comoros 43.2, Djibouti 29.7, Eritrea 39.5,Fiji 5.6, Gambia 57.5, Guinea-Bissau 55.2,Guyana 1.0, Haiti 45.2, and Lebanon 11.7.g. UNICEF 2005.h. UNESCO Institute for Statistics estimates based onits Global Age-specifi c Literacy Projections model(2007).i. An adult illiteracy rate of 0.2 was used to calculatethe HPI-1 for Cuba.j. Data are from national sources.k. Data are from the Secretariat of the CaribbeanCommunity, based on national sources.l. UNICEF 2004.m. UNDP 2006.SOURCESColumn 1: determined on the basis of HPI-1values in column 2.Column 2: calculated on the basis of data incolumns 3–6, see Technical note 1 for details.Column 3: UN 2007e.Column 4: calculated on the basis of data onadult literacy rates from UNESCO Institute forStatistics 2007a.Column 5: UN 2006a, based on a joint effort byUNICEF and WHO.Column 6: UNICEF 2006.Columns 7–9: World Bank 2007b.Column 10: calculated on the basis of data incolumns 1 and 7.HPI-1 ranks for 108 developing countries and areasHuman development indicators1 Barbados2 Uruguay3 Chile4 Argentina5 Costa Rica6 Cuba7 Singapore8 Saint Lucia9 Occupied PalestinianTerritories10 Mexico11 Jordan12 Trinidad and Tobago13 Qatar14 Colombia15 Panama16 Malaysia17 United Arab Emirates18 Lebanon19 Ecuador20 Paraguay21 Venezuela (BolivarianRepublic of)22 Turkey23 Brazil24 Thailand25 Suriname26 Dominican Republic27 Mauritius28 Peru29 China30 Iran (Islamic Republic of)31 Syrian Arab Republic32 Bolivia33 Guyana34 Jamaica35 El Salvador36 Viet Nam37 Philippines38 Cape Verde39 Sao Tome and Principe40 Mongolia41 Honduras42 Maldives43 Belize44 Sri Lanka45 Tunisia46 Nicaragua47 Indonesia48 Egypt49 Gabon50 Fiji51 Algeria52 Myanmar53 Solomon Islands54 Guatemala55 South Africa56 Vanuatu57 Congo58 Namibia59 Djibouti60 Kenya61 Comoros62 India63 Botswana64 Cameroon65 Ghana66 Equatorial Guinea67 Tanzania (United Republic of)68 Morocco69 Sudan70 Lao People’s DemocraticRepublic71 Lesotho72 Uganda73 Swaziland74 Haiti75 Madagascar76 Eritrea77 Pakistan78 Rwanda79 Malawi80 Nigeria81 Burundi82 Yemen83 Togo84 Nepal85 Cambodia86 Bhutan87 Mauritania88 Congo (Democratic Republicof the)89 Angola90 Papua New Guinea91 Zimbabwe92 Côte d’Ivoire93 Bangladesh94 Gambia95 Timor-Leste96 Zambia97 Senegal98 Central African Republic99 Guinea-Bissau100 Benin101 Mozambique102 Sierra Leone103 Guinea104 Niger105 Ethiopia106 Burkina Faso107 Mali108 Chad240 HUMAN DEVELOPMENT REPORT 2007/2008