- Page 2 and 3:
Copyright © 2007by the United Nati
- Page 4:
ForewordWhat we do today about clim
- Page 7 and 8:
AcknowledgementsThis Report could n
- Page 9 and 10:
Jean-Robert Moret, Koos Neefjes, Ii
- Page 11 and 12:
From climate shocks today to depriv
- Page 13 and 14:
Figures1.1 Rising CO 2emissions are
- Page 15 and 16:
… while preserving it for future
- Page 17 and 18:
Climate change providesa potent rem
- Page 19 and 20:
The real choice facingpolitical lea
- Page 21 and 22:
The world’s poor andfuture genera
- Page 23 and 24:
Current investment patternsare putt
- Page 25 and 26:
Avoiding the unprecedentedthreats p
- Page 27 and 28:
The rapid development anddeployment
- Page 29 and 30:
Support for the MDGsprovides anothe
- Page 31 and 32:
For the current generation,the chal
- Page 33 and 34: • Create a Climate Change Mitigat
- Page 35 and 36: “One generation plants a tree; th
- Page 37 and 38: 1The 21 st Century climate challeng
- Page 39 and 40: 1The 21 st Century climate challeng
- Page 41 and 42: 1The 21 st Century climate challeng
- Page 43 and 44: 1Special contributionClimate policy
- Page 45 and 46: 1The 21 st Century climate challeng
- Page 47 and 48: 1The 21 st Century climate challeng
- Page 49 and 50: 1The 21 st Century climate challeng
- Page 51 and 52: 1The 21 st Century climate challeng
- Page 53 and 54: 1The 21 st Century climate challeng
- Page 55 and 56: 1 The 21 st Century climate challen
- Page 57 and 58: 1The 21 st Century climate challeng
- Page 59 and 60: 1The 21 st Century climate challeng
- Page 61 and 62: 1The 21 st Century climate challeng
- Page 63 and 64: 1The 21 st Century climate challeng
- Page 65 and 66: 1The 21 st Century climate challeng
- Page 67 and 68: 1The 21 st Century climate challeng
- Page 69 and 70: 1Box 1.3Developed countries have fa
- Page 71 and 72: 1The 21 st Century climate challeng
- Page 73 and 74: 1The 21 st Century climate challeng
- Page 75 and 76: 1The 21 st Century climate challeng
- Page 77 and 78: 1The 21 st Century climate challeng
- Page 79 and 80: 1The 21 st Century climate challeng
- Page 81 and 82: 1The 21 st Century climate challeng
- Page 83: 1The 21 st Century climate challeng
- Page 87 and 88: “The countries most vulnerable ar
- Page 89 and 90: 2Climate shocks: risk and vulnerabi
- Page 91 and 92: 2Climate shocks: risk and vulnerabi
- Page 93 and 94: 2Climate shocks: risk and vulnerabi
- Page 95 and 96: 2Climate shocks: risk and vulnerabi
- Page 97 and 98: Special contributionClimate change
- Page 99 and 100: 2Climate shocks: risk and vulnerabi
- Page 101 and 102: 2Climate shocks: risk and vulnerabi
- Page 103 and 104: 2Climate shocks: risk and vulnerabi
- Page 105 and 106: Developing countries arelikely to b
- Page 107 and 108: 2Climate shocks: risk and vulnerabi
- Page 109 and 110: 2Climate shocks: risk and vulnerabi
- Page 111 and 112: 2Climate shocks: risk and vulnerabi
- Page 113 and 114: 2Climate shocks: risk and vulnerabi
- Page 115 and 116: 2Climate shocks: risk and vulnerabi
- Page 117 and 118: 2Climate shocks: risk and vulnerabi
- Page 119 and 120: 2Climate shocks: risk and vulnerabi
- Page 121 and 122: 2Climate shocks: risk and vulnerabi
- Page 124 and 125: Avoiding dangerousclimate change:st
- Page 126 and 127: CHAPTER3Avoidingdangerous climate c
- Page 128 and 129: Without a credible multilateral fra
- Page 130 and 131: eaffirmed this commitment by adopti
- Page 132 and 133: Special contributionNew York City t
- Page 134 and 135:
latter figure represents around 2 p
- Page 136 and 137:
Box 3.3The United Kingdom's climate
- Page 138 and 139:
Box 3.4The European Union—2020 ta
- Page 140 and 141:
As these positive examples suggest,
- Page 142 and 143:
advantages. Even so, tax systems ca
- Page 144 and 145:
Cap-and-trade—lessons from theEU
- Page 146 and 147:
Prospects for the second phaseWill
- Page 148 and 149:
mitigation. Viewed differently, the
- Page 150 and 151:
investment through the creation of
- Page 152 and 153:
Would these efficiency gains deal a
- Page 154 and 155:
Box 3.8Vehicle emissions standards
- Page 156 and 157:
Special contributionNational action
- Page 158 and 159:
Brazil, an import duty of €0.73 (
- Page 160 and 161:
These R&D patterns can be traced to
- Page 162 and 163:
and deployment. Higher costs associ
- Page 164 and 165:
scenario' in which governments deep
- Page 166 and 167:
Box 3.10Coal and energy policy refo
- Page 168 and 169:
countries speeding-up the deploymen
- Page 170 and 171:
are ‘additional’, and monitorin
- Page 172 and 173:
are strong efficiency and equity gr
- Page 174 and 175:
immense opportunities for carbon mi
- Page 176:
the permanence of mitigation throug
- Page 179 and 180:
“If you are neutral in a situatio
- Page 181 and 182:
his special contribution to this Re
- Page 183 and 184:
Planning for adaptation4.1 The nati
- Page 185 and 186:
4Adapting to the inevitable: nation
- Page 187 and 188:
4Adapting to the inevitable: nation
- Page 189 and 190:
4Adapting to the inevitable: nation
- Page 191 and 192:
4Adapting to the inevitable: nation
- Page 193 and 194:
4Adapting to the inevitable: nation
- Page 195 and 196:
Box 4.2The Productive Safety Net Pr
- Page 197 and 198:
Box 4.4Reducing vulnerability throu
- Page 199 and 200:
Box 4.6Learning from experience in
- Page 201 and 202:
4Adapting to the inevitable: nation
- Page 203 and 204:
4Adapting to the inevitable: nation
- Page 205 and 206:
4Adapting to the inevitable: nation
- Page 207 and 208:
4Adapting to the inevitable: nation
- Page 209 and 210:
4Adapting to the inevitable: nation
- Page 211 and 212:
4Adapting to the inevitable: nation
- Page 213 and 214:
Successful adaptationcoupled with s
- Page 215 and 216:
72 Council on Foreign Relations 200
- Page 217 and 218:
119 Government of the United Kingdo
- Page 219 and 220:
BibliographyBackground PapersArroyo
- Page 221 and 222:
Bouwer, L.M. and J.C. Aerts. 2006.
- Page 223 and 224:
Davidson, Ogunlade, Harald Winkler,
- Page 225 and 226:
Government of Australia. 2007. Nati
- Page 227 and 228:
International Network for Sustainab
- Page 229 and 230:
———. 2006. “The Stern Revie
- Page 231 and 232:
Linkages. Final Report. Overseas De
- Page 233:
economics.harvard.edu/faculty/Weitz
- Page 237 and 238:
tinues to advocate improving intern
- Page 239 and 240:
inal energy and environment table a
- Page 241 and 242:
expectancy estimates published by U
- Page 243 and 244:
Acronyms and abbreviationsCDIACCISC
- Page 245 and 246:
TABLE1Human development indexHuman
- Page 247 and 248:
TABLE1Human development indexHuman
- Page 249 and 250:
TABLE2Monitoringhuman development:
- Page 251 and 252:
TABLE2 Human development index tren
- Page 253 and 254:
TABLE3Monitoring human development:
- Page 255 and 256:
TABLE3 Human and income poverty: de
- Page 257 and 258:
Human and income poverty: OECD coun
- Page 259 and 260:
TABLE5 Demographic trendsHuman deve
- Page 261 and 262:
TABLE5 Demographic trendsHDI rankTo
- Page 263 and 264:
TABLE6Commitment to health: resourc
- Page 265 and 266:
TABLE6Commitment to health: resourc
- Page 267 and 268:
TABLE7 Water, sanitation and nutrit
- Page 269 and 270:
TABLE7 Water, sanitation and nutrit
- Page 271 and 272:
TABLEInequalities in maternal and c
- Page 273 and 274:
TABLE9 Leading global health crises
- Page 275 and 276:
HIVprevalence a(% aged15-49)MDGCond
- Page 277 and 278:
TABLE10 Survival: progress and setb
- Page 279 and 280:
HDI rankLife expectancy at birth(ye
- Page 281 and 282:
TABLE11 Commitment to education: pu
- Page 283 and 284:
Public expenditure on educationCurr
- Page 285 and 286:
TABLE12 Literacy and enrolmentHuman
- Page 287 and 288:
TABLE12 Literacy and enrolmentAdult
- Page 289 and 290:
TABLE13 Technology: diffusion and c
- Page 291 and 292:
MDGTelephone mainlines a(per 1,000
- Page 293 and 294:
TABLE14Economic performanceHuman de
- Page 295 and 296:
GDP per capitaGDPHighestvalue durin
- Page 297 and 298:
TABLE15 Inequality in income or exp
- Page 299 and 300:
MDGInequality measuresShare of inco
- Page 301 and 302:
TABLE16 Structure of tradeHuman dev
- Page 303 and 304:
HDI rankImports of goodsand service
- Page 305 and 306:
TABLE18.. . to have access to the r
- Page 307 and 308:
TABLE18 Flows of aid, private capit
- Page 309 and 310:
TABLE19.. . to have access to the r
- Page 311 and 312:
TABLE19 Priorities in public spendi
- Page 313 and 314:
Unemployedpeople(thousands)Total(%
- Page 315 and 316:
TABLE21 Unemployment and informal s
- Page 317 and 318:
TABLE22.. . while preserving it for
- Page 319 and 320:
TABLE22 Energy and the environmentH
- Page 321 and 322:
TABLE23. . . while preserving it fo
- Page 323 and 324:
TABLE23Energy sourcesShare of TPES
- Page 325 and 326:
TABLE24.. . while preserving it for
- Page 327 and 328:
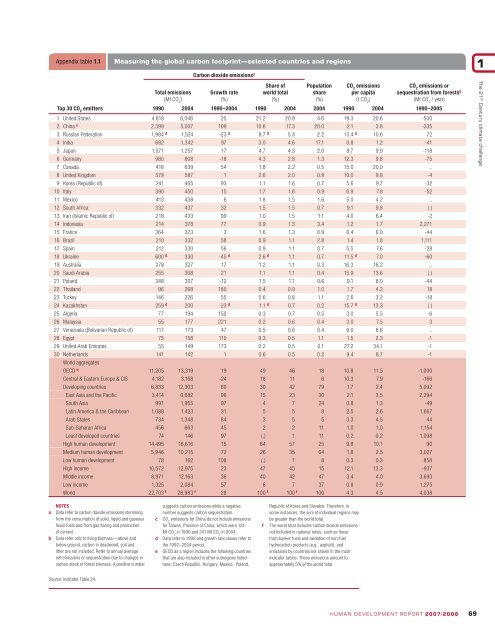
TABLE24 Carbon dioxide emissions an
- Page 329 and 330:
TABLE25.. . while preserving it for
- Page 331 and 332:
TABLE25 Status of major internation
- Page 333 and 334:
TABLE26.. . protecting personal sec
- Page 335 and 336:
TABLE26 Refugees and armamentsHuman
- Page 337 and 338:
TABLE27.. . protecting personal sec
- Page 339 and 340:
TABLE27 Crime and justiceHuman deve
- Page 341 and 342:
TABLE28.. . and achieving equality
- Page 343 and 344:
TABLE28 Gender-related development
- Page 345 and 346:
TABLE29.. . and achieving equality
- Page 347 and 348:
TABLE29 Gender empowerment measureH
- Page 349 and 350:
TABLE30.. . and achieving equality
- Page 351 and 352:
TABLE30 Gender inequality in educat
- Page 353 and 354:
TABLE31.. . and achieving equality
- Page 355 and 356:
TABLE31 Gender inequality in econom
- Page 357 and 358:
TABLE32.. . and achieving equality
- Page 359 and 360:
TABLE33 Women’s political partici
- Page 361 and 362:
TABLE33 Women’s political partici
- Page 363 and 364:
TABLE34 Status of major internation
- Page 365 and 366:
HDI rankInternationalConvention on
- Page 367 and 368:
TABLE35 Status of fundamental labou
- Page 369 and 370:
HDI rankFreedom of association andc
- Page 371 and 372:
90Goalpost85 years8071.470600.7731.
- Page 373 and 374:
358 HUMAN DEVELOPMENT REPORT 2007/2
- Page 375 and 376:
360 HUMAN DEVELOPMENT REPORT 2007/2
- Page 377 and 378:
TECHNICAL NOTE 2Measuring the short
- Page 379 and 380:
Definitions of statistical termsAnt
- Page 381 and 382:
Enrolment ratio, gross The total nu
- Page 383 and 384:
Statistics (the Delhi Group) includ
- Page 385 and 386:
yet received a decision or is other
- Page 387 and 388:
Statistical referencesAmnesty Inter
- Page 389 and 390:
Classification of countriesCountrie
- Page 391 and 392:
Countries in the major world aggreg
- Page 393 and 394:
Index to indicatorsIndicator table
- Page 395 and 396:
Indicator table Indicator Indicator
- Page 397 and 398:
Indicator table Indicator Indicator
- Page 399:
Index to Millennium Development Goa