- Page 1 and 2:
LIST OF ANNEXURESANNEXURE I 1:ANNEX
- Page 3 and 4:
The Map 2 below shows the location
- Page 5 and 6:
the area.2.3 MsingaOwing to its rug
- Page 7 and 8:
Table No 2: KwaZulu Natal Comparati
- Page 9 and 10:
government, business chambers and s
- Page 11 and 12:
Figure 3: Households per Income Cat
- Page 13 and 14:
Figure 6: Growth in Annual Total Di
- Page 15 and 16:
4.4.2 POVERTY GAPThe poverty gap ca
- Page 17 and 18:
Figure 10: Gross Operating Surplus
- Page 19 and 20:
Figure 12: Gross Value Added per Re
- Page 21 and 22:
Figure 15: uMzinyathi DM’s Share
- Page 23 and 24:
Figure 17: Annual Growth Rate in th
- Page 25 and 26:
Source : Global Insight of SA (1996
- Page 27 and 28:
Figure 22 :Umzinyathi DM’s Contri
- Page 29 and 30:
Figure 24: Total Employment in the
- Page 31 and 32:
Figure 26 : Sanitation ProvisionSou
- Page 33 and 34:
4.8.5 HOUSINGThe following figure i
- Page 35 and 36:
Two Steering Committee meetings hav
- Page 37 and 38:
ACTIONSRESPONSIBLE PERSON TARGET DA
- Page 39 and 40:
with no formal education are in Msi
- Page 41 and 42:
accountable manner as required by S
- Page 43 and 44:
facilitates the processes of democr
- Page 45 and 46:
(h) identify and address weaknesses
- Page 47 and 48:
Principle 2:Principle 3:Principle 4
- Page 49 and 50:
3.4 Provincial Growth and Developme
- Page 51 and 52:
4146PGDS STRATEGICGOALS2 HUMA RESOU
- Page 53 and 54:
The municipality has a turnaround s
- Page 55 and 56:
Hlatshwayo Traditional Council - In
- Page 57 and 58:
2.1 Land Reform and RestitutionMap
- Page 59 and 60:
2.3 ENVIRONMANTAL ANALYSIS2.3.1 Wat
- Page 61 and 62:
Wetland delineation should thus be
- Page 63 and 64:
Wood burnMap 6: Showing Umzinyathi
- Page 65 and 66:
Forests Act, 1998 (Act No. 84 of 19
- Page 67 and 68:
The municipality, in partnership wi
- Page 69 and 70:
Proposed Interventions:Plan and imp
- Page 71 and 72:
2.3.6 Air QualityPollutantsIndustri
- Page 73 and 74:
Nquthu MunicipalityLand degradation
- Page 75 and 76:
Main Category (DISTRICT RISK RATING
- Page 77 and 78:
OPPORTUNITIES Formalization of Noda
- Page 79 and 80:
Disclose all information on debts.I
- Page 81 and 82:
5.2.3 Municipal Institutional Capac
- Page 83 and 84:
y the said Act, through the underta
- Page 85 and 86:
IDP RepresentativeForumPlanningandD
- Page 87 and 88:
sectors within the district. Theref
- Page 89 and 90:
MUNICIPALSTRUCTUREIDP TechnicalComm
- Page 91 and 92:
5.11.1 Development Planning Strateg
- Page 93 and 94:
6. GOOD GOVERNANCE AND PUBLIC PARTI
- Page 95 and 96:
2) Local EconomicDevelopmentI appla
- Page 97 and 98:
The effectiveness of your IGRstruct
- Page 99 and 100:
5) Good Governance andPublic Partic
- Page 101 and 102:
objectives and strategies.The repor
- Page 103 and 104:
9) Municipal turn AroundStrategy (M
- Page 105 and 106:
6.2.1 Public ParticipationIn terms
- Page 107 and 108:
7. SERVICE DELIVERY & INFRASTRUCTUR
- Page 109 and 110:
7.1.4 Solid Waste ManagementThe fol
- Page 111 and 112:
• Actual households count from re
- Page 113 and 114:
7.6 Sector Plans Water Services Dev
- Page 115 and 116:
• Customer care centre not fully
- Page 117 and 118:
Figure 32: Formal Employment per Se
- Page 119 and 120:
8.2.5 Index of Buying PowerAn Index
- Page 121 and 122:
8.3 POVERTY8.3.1 Number of People i
- Page 123 and 124: Figure 40: Gini CoefficientSource :
- Page 125 and 126: AMOUNTFigure 42: Gross Value Added
- Page 127 and 128: Figure 45: GVA- R Sector Compositio
- Page 129 and 130: Figure 48: Annual Growth Rate in th
- Page 131 and 132: 8.4.3 FinanceThe following figure s
- Page 133 and 134: Figure 53: Umzinyathi DM’s Contri
- Page 135 and 136: Figute 55: Total Employment in the
- Page 137 and 138: 8.7.2 Key LED Programmes of Economi
- Page 139 and 140: ooooooIncrease agricultural areas u
- Page 141 and 142: 9. FINANCIAL VIABILITY AND MANAGEME
- Page 143 and 144: SECTION D: VISION, GOALS, OBJECTIVE
- Page 145 and 146: Access Roads (5) Environmental Mana
- Page 147 and 148: its facilitiesHuman Settlement (10)
- Page 149 and 150: PGDS Strategic Goals Key Performanc
- Page 151 and 152: SECTION E: STRATEGIC MAPPING AND IM
- Page 153 and 154: The second focus area is more detai
- Page 155 and 156: 1.6 The legislative and policy envi
- Page 157 and 158: Map 10: KZN SDF Nodal structureUmgu
- Page 159 and 160: prescribe to another. The DM’s SD
- Page 161 and 162: 3.3 FrostLinked to the location of
- Page 163 and 164: An analysis of the terrain elevatio
- Page 165 and 166: Examples of land degradation throug
- Page 167 and 168: The key issue to consider from the
- Page 169 and 170: All the areas report very low house
- Page 171 and 172: Airfield in UmzinyathiAirfield ICAO
- Page 173: Map 18: Access and functional links
- Page 177 and 178: Basic and more(Electricity or solar
- Page 179 and 180: The above section shows access to l
- Page 181 and 182: Map 24: Access to health facilities
- Page 183 and 184: ReligiousCommunityGovernmentMosqueM
- Page 185 and 186: 6.2 Period of residenceMap 26: Peri
- Page 187 and 188: 1995 2000 2005 201080 +75 - 7970 -
- Page 189 and 190: The graph below shows the household
- Page 191 and 192: AgricultureMiningManufacturingUtili
- Page 193 and 194: Map 27: Land capabilityLand capabil
- Page 195 and 196: 9. MiningThe area around Glencoe an
- Page 197 and 198: It is not clear if any of these pro
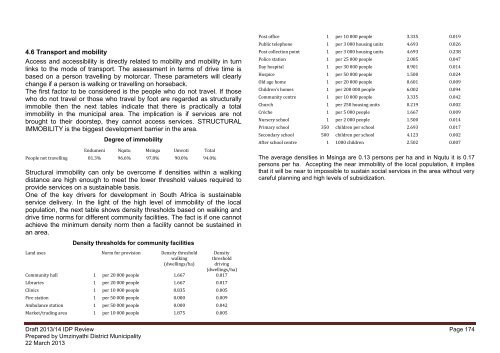
- Page 199 and 200: Facility densities and accessibilit
- Page 201 and 202: then one has no choice but to accep
- Page 203 and 204: Element Opportunities Challengeshar
- Page 205 and 206: Map 33: Form giving elements (exclu
- Page 207 and 208: There is no indication for any pote
- Page 209 and 210: in terms of land capability. These
- Page 211 and 212: Map 35: Umzinyathi Spatial Developm
- Page 213 and 214: High Potential Agricultural LandThe
- Page 215 and 216: accommodated in the formal urban ar
- Page 217 and 218: From an urban efficiency and functi
- Page 219 and 220: enhancing environments with maximum
- Page 221 and 222: these areas will contribute to an i
- Page 223 and 224: 5. Unresolved land claims might hav
- Page 225 and 226:
The projects linked or supporting t
- Page 227 and 228:
Project 1:Infrastructure Investment
- Page 229 and 230:
Project 2:Investigation into the es
- Page 231 and 232:
3. Revisiting the SDFs of the LMs w
- Page 233 and 234:
Spatial integration of communities
- Page 235 and 236:
Governance: Maintaining effective s
- Page 237 and 238:
healthy environment by ensuring tha
- Page 239 and 240:
Investigate different water availab
- Page 241 and 242:
2.2.2 BiodiversityAssetIndigenous f
- Page 243 and 244:
All EIA‘s for developments to con
- Page 245 and 246:
Proposed Interventions:Protect heri
- Page 247 and 248:
Map 39: Showing Umzinyathi DM Waste
- Page 249 and 250:
Management statusSites of Conservat
- Page 251 and 252:
4. ISSUES IDENTIFED PER LOCAL MUNIC
- Page 253 and 254:
Environmental Issue Strategy Projec
- Page 255 and 256:
The municipality is in the process
- Page 257 and 258:
PGDSStrategicGoal(s)National KeyPer
- Page 259 and 260:
PGDSStrategicGoal(s)National KeyPer
- Page 261 and 262:
PGDSStrategicGoal(s)National KeyPer
- Page 263 and 264:
2. CAPITAL INFRASTRUCTURE INVESTMEN
- Page 265 and 266:
MunicipalityGlenco/Sithembile BulkW
- Page 267 and 268:
Makhabeleni Phase 6Mbulwane/ Hlimbi
- Page 269 and 270:
MsingavegetableproductionNquthuPrim
- Page 271 and 272:
AgriculturalMechanizationunitFarmin
- Page 273 and 274:
SEDAcontractorincubatorBlack emergi
- Page 275 and 276:
only Endumeni Municipalityhas a fun
- Page 277 and 278:
SECTION F: FINANCIAL PLAN1. BUDGET
- Page 279 and 280:
TOTAL OPERATING BUDGET 2013/2014, 2
- Page 281 and 282:
The largest allocation of the capit
- Page 283 and 284:
There has been a lack of progress a
- Page 285 and 286:
efined and revised amongst other th
- Page 287 and 288:
the annual report.14. The reported
- Page 289 and 290:
4. MUNICIPAL ACTION PLAN TO ADDRESS
- Page 291 and 292:
SECTION H: ORGANISATIONAL AND INDIV
- Page 293 and 294:
The municipality will also undertak
- Page 295 and 296:
Table 14: Filling of Section 56/7 M
- Page 297 and 298:
Table 20: Workplace Skills Plans su
- Page 299 and 300:
ActualTargetActualTargetActualTarge
- Page 301 and 302:
Indigent Policy implementation with
- Page 303 and 304:
3.3 LOCAL ECONOMIC DEVELOPMENTTable
- Page 305 and 306:
envisaged that the agency would tak
- Page 307 and 308:
Financial ViabilityTable 34: Outsta
- Page 309 and 310:
Councillors and staff membersin arr
- Page 311 and 312:
3.5.1 CHALLENGESReview and effectiv
- Page 313 and 314:
Inavailability of reliable data:Alt
- Page 315 and 316:
SECTION I: ANNEXURESNo IDP Componen
- Page 317:
Draft 2013/14 IDP Review Page 317Pr