- Page 1:
Pay TV phase three document Propose
- Page 4 and 5:
Section 1 1 Summary Pay TV phase th
- Page 6 and 7:
Pay TV phase three document - non-c
- Page 8 and 9:
Pay TV phase three document - non-c
- Page 10 and 11:
Pay TV phase three document - non-c
- Page 12 and 13:
Pay TV phase three document - non-c
- Page 14 and 15:
Pay TV phase three document - non-c
- Page 16 and 17:
Pay TV phase three document - non-c
- Page 18 and 19:
Pay TV phase three document - non-c
- Page 20 and 21:
Pay TV phase three document - non-c
- Page 22 and 23:
Pay TV phase three document - non-c
- Page 24 and 25:
(4) In this section— Pay TV phase
- Page 26 and 27:
Pay TV phase three document - non-c
- Page 28 and 29:
Pay TV phase three document - non-c
- Page 30 and 31:
Ofcom’s views Pay TV phase three
- Page 32 and 33:
Pay TV phase three document - non-c
- Page 34 and 35:
Pay TV phase three document - non-c
- Page 36 and 37:
Pay TV phase three document - non-c
- Page 38 and 39:
� Annex 3: consultation response
- Page 40 and 41:
Pay TV phase three document - non-c
- Page 42 and 43:
Pay TV phase three document - non-c
- Page 44 and 45:
Pay TV phase three document - non-c
- Page 46 and 47:
Pay TV phase three document - non-c
- Page 48 and 49:
Content aggregation and market powe
- Page 50 and 51:
Pay TV phase three document - non-c
- Page 52 and 53:
Pay TV phase three document - non-c
- Page 54 and 55:
Section 4 4 Market definition Summa
- Page 56 and 57:
Pay TV phase three document - non-c
- Page 58 and 59:
Pay TV phase three document - non-c
- Page 60 and 61:
Pay TV phase three document - non-c
- Page 62 and 63:
Respondents’ views 4.36 Sky comme
- Page 64 and 65:
Pay TV phase three document - non-c
- Page 66 and 67:
Pay TV phase three document - non-c
- Page 68 and 69:
Pay TV phase three document - non-c
- Page 70 and 71:
Pay TV phase three document - non-c
- Page 72 and 73:
Pay TV phase three document - non-c
- Page 74 and 75:
Respondents’ views Pay TV phase t
- Page 76 and 77:
Pay TV phase three document - non-c
- Page 78 and 79:
Pay TV phase three document - non-c
- Page 80 and 81:
Pay TV phase three document - non-c
- Page 82 and 83:
Pay TV phase three document - non-c
- Page 84 and 85:
Pay TV phase three document - non-c
- Page 86 and 87:
Pay TV phase three document - non-c
- Page 88 and 89:
Pay TV phase three document - non-c
- Page 90 and 91:
Pay TV phase three document - non-c
- Page 92 and 93:
Pay TV phase three document - non-c
- Page 94 and 95:
Our current view Pay TV phase three
- Page 96 and 97:
Pay TV phase three document - non-c
- Page 98 and 99:
Pay TV phase three document - non-c
- Page 100 and 101:
Pay TV phase three document - non-c
- Page 102 and 103:
Retail markets for premium sports c
- Page 104 and 105:
Responses to our consultation Pay T
- Page 106 and 107:
Pay TV phase three document - non-c
- Page 108 and 109:
Pay TV phase three document - non-c
- Page 110 and 111:
Pay TV phase three document - non-c
- Page 112 and 113:
Pay TV phase three document - non-c
- Page 114 and 115:
Pay TV phase three document - non-c
- Page 116 and 117:
Pay TV phase three document - non-c
- Page 118 and 119:
Pay TV phase three document - non-c
- Page 120 and 121:
Consumers’ observed responses to
- Page 122 and 123:
Pay TV phase three document - non-c
- Page 124 and 125:
Pay TV phase three document - non-c
- Page 126 and 127:
Pay TV phase three document - non-c
- Page 128 and 129:
Pay TV phase three document - non-c
- Page 130 and 131:
Pay TV phase three document - non-c
- Page 132 and 133:
Pay TV phase three document - non-c
- Page 134 and 135:
Pay TV phase three document - non-c
- Page 136 and 137:
Our current view Pay TV phase three
- Page 138 and 139:
Our current view Pay TV phase three
- Page 140 and 141:
Section 5 5 Market power Summary Pa
- Page 142 and 143:
Pay TV phase three document - non-c
- Page 144 and 145:
Pay TV phase three document - non-c
- Page 146 and 147:
Pay TV phase three document - non-c
- Page 148 and 149:
Pay TV phase three document - non-c
- Page 150 and 151:
Pay TV phase three document - non-c
- Page 152 and 153:
Event Total annual value of live ri
- Page 154 and 155:
Pay TV phase three document - non-c
- Page 156 and 157:
Pay TV phase three document - non-c
- Page 158 and 159:
Pay TV phase three document - non-c
- Page 160 and 161:
Pay TV phase three document - non-c
- Page 162 and 163:
Pay TV phase three document - non-c
- Page 164 and 165:
Pay TV phase three document - non-c
- Page 166 and 167:
Pay TV phase three document - non-c
- Page 168 and 169:
Pay TV phase three document - non-c
- Page 170 and 171:
Pay TV phase three document - non-c
- Page 172 and 173:
� DTT. � IPTV. Pay TV phase thr
- Page 174 and 175:
Pay TV phase three document - non-c
- Page 176 and 177:
Production differentiation Pay TV p
- Page 178 and 179:
Pay TV phase three document - non-c
- Page 180 and 181:
Barriers to entry and expansion Pay
- Page 182 and 183:
Section 6 6 Competition issues Summ
- Page 184 and 185:
Pay TV phase three document - non-c
- Page 186 and 187:
Pay TV phase three document - non-c
- Page 188 and 189:
Background Pay TV phase three docum
- Page 190 and 191:
Figure 50 Distribution of Setanta p
- Page 192 and 193:
[ � ] 376 [ � ] 377 Pay TV phas
- Page 194 and 195:
Pay TV phase three document - non-c
- Page 196 and 197:
Pay TV phase three document - non-c
- Page 198 and 199:
Pay TV phase three document - non-c
- Page 200 and 201:
Pay TV phase three document - non-c
- Page 202 and 203:
Pay TV phase three document - non-c
- Page 204 and 205:
Pay TV phase three document - non-c
- Page 206 and 207:
Pay TV phase three document - non-c
- Page 208 and 209:
Pay TV phase three document - non-c
- Page 210 and 211:
Pay TV phase three document - non-c
- Page 212 and 213:
Pay TV phase three document - non-c
- Page 214 and 215:
Pay TV phase three document - non-c
- Page 216 and 217:
Pay TV phase three document - non-c
- Page 218 and 219:
Pay TV phase three document - non-c
- Page 220 and 221:
Pay TV phase three document - non-c
- Page 222 and 223:
Pay TV phase three document - non-c
- Page 224 and 225:
Section 7 7 Consumer effects Summar
- Page 226 and 227:
Pay TV phase three document - non-c
- Page 228 and 229:
Pay TV phase three document - non-c
- Page 230 and 231:
Pay TV phase three document - non-c
- Page 232 and 233:
Choice Pay TV phase three document
- Page 234 and 235:
Pay TV phase three document - non-c
- Page 236 and 237:
Sky Core Premium customers on DSat
- Page 238 and 239:
Premium customers on cable Pay TV p
- Page 240 and 241:
Distorted choice of bundles Pay TV
- Page 242 and 243:
Pay TV phase three document - non-c
- Page 244 and 245:
Pay TV phase three document - non-c
- Page 246 and 247:
Pay TV phase three document - non-c
- Page 248 and 249:
Pay TV phase three document - non-c
- Page 250 and 251:
Pay TV phase three document - non-c
- Page 252 and 253:
� Whether the firm has market pow
- Page 254 and 255: Pay TV phase three document - non-c
- Page 256 and 257: Pay TV phase three document - non-c
- Page 258 and 259: Pay TV phase three document - non-c
- Page 260 and 261: Pay TV phase three document - non-c
- Page 262 and 263: Pay TV phase three document - non-c
- Page 264 and 265: Pay TV phase three document - non-c
- Page 266 and 267: Pay TV phase three document - non-c
- Page 268 and 269: Section 9 Pay TV phase three docume
- Page 270 and 271: Pay TV phase three document - non-c
- Page 272 and 273: Set of relevant wholesale products
- Page 274 and 275: Pay TV phase three document - non-c
- Page 276 and 277: Pay TV phase three document - non-c
- Page 278 and 279: Pay TV phase three document - non-c
- Page 280 and 281: Pay TV phase three document - non-c
- Page 282 and 283: Pay TV phase three document - non-c
- Page 284 and 285: Pay TV phase three document - non-c
- Page 286 and 287: Pay TV phase three document - non-c
- Page 288 and 289: Pay TV phase three document - non-c
- Page 290 and 291: Pay TV phase three document - non-c
- Page 292 and 293: Pay TV phase three document - non-c
- Page 294 and 295: Pay TV phase three document - non-c
- Page 296 and 297: Pay TV phase three document - non-c
- Page 298 and 299: Pay TV phase three document - non-c
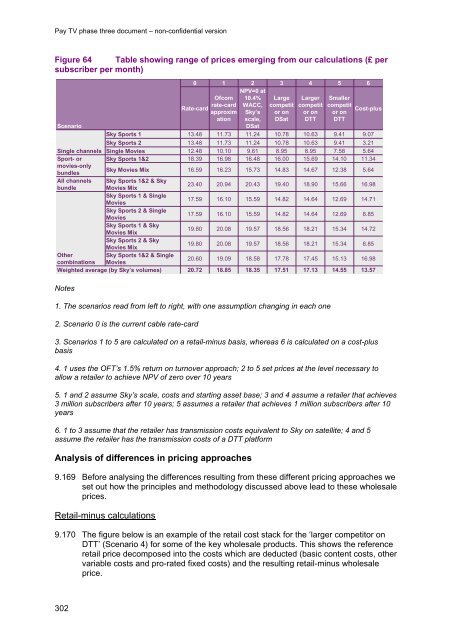
- Page 300 and 301: Pay TV phase three document - non-c
- Page 302 and 303: Pay TV phase three document - non-c
- Page 306 and 307: Figure 65 Retail cost stack £ per
- Page 308 and 309: Figure 67 Cost-plus cost stack £ p
- Page 310 and 311: Pay TV phase three document - non-c
- Page 312 and 313: Pay TV phase three document - non-c
- Page 314 and 315: Pay TV phase three document - non-c
- Page 316 and 317: Pay TV phase three document - non-c
- Page 318 and 319: Pay TV phase three document - non-c
- Page 320 and 321: Pay TV phase three document - non-c
- Page 322 and 323: Section 10 Pay TV phase three docum
- Page 324 and 325: Pay TV phase three document - non-c
- Page 326 and 327: Pay TV phase three document - non-c
- Page 328 and 329: Pay TV phase three document - non-c
- Page 330 and 331: Effects on retail prices Pay TV pha
- Page 332 and 333: Pay TV phase three document - non-c
- Page 334 and 335: Pay TV phase three document - non-c
- Page 336 and 337: Pay TV phase three document - non-c
- Page 338 and 339: Section 11 Pay TV phase three docum
- Page 340 and 341: Consultation questions Pay TV phase
- Page 342 and 343: Pay TV phase three document - non-c
- Page 344 and 345: Pay TV phase three document - non-c
- Page 346 and 347: Pay TV phase three document - non-c
- Page 348 and 349: Pay TV phase three document - non-c
- Page 350 and 351: Annex 1 1 Responding to this consul
- Page 352 and 353: Annex 2 2 Ofcom’s consultation pr
- Page 354 and 355:
Cover sheet for response to an Ofco
- Page 356 and 357:
Pay TV phase three document - non-c
- Page 358 and 359:
Pay TV phase three document - non-c
- Page 360:
Pay TV phase three document - non-c