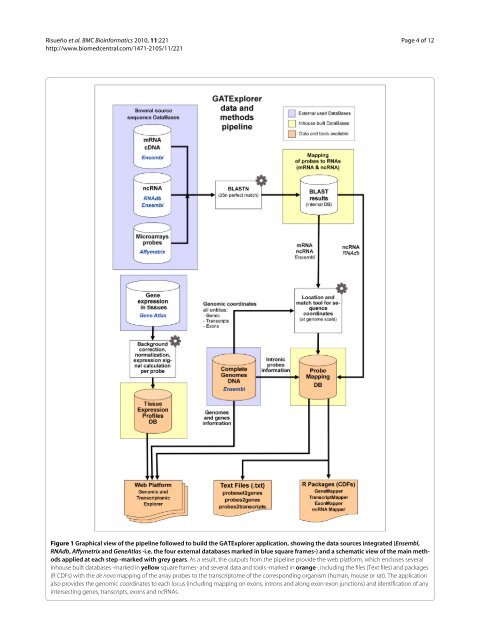
<strong>Risueño</strong> et al. BMC Bioinformatics 2010, 11:221 http://www.biomedcentral.com/1471-2105/11/221 Page 4 of 12 Figure 1 Graphical view of the pipeline followed to build the GATExplorer application, showing the data sources integrated (Ensembl, RNAdb, Affymetrix and GeneAtlas -i.e. the four external databases marked in blue square frames-) and a schematic view of the main methods applied at each step -marked with grey gears. As a result, the outputs from the pipeline provi<strong>de</strong> the web platform, which encloses several inhouse built databases -marked in yellow square frames- and several data and tools -marked in orange-, including the files (Text files) and packages (R CDFs) with the <strong>de</strong> novo mapping of the array probes to the transcriptome of the corresponding organism (human, mouse or rat). The application also provi<strong>de</strong>s the genomic coordinates to each locus (including mapping on exons, introns and along exon-exon junctions) and i<strong>de</strong>ntification of any intersecting genes, transcripts, exons and ncRNAs.
<strong>Risueño</strong> et al. BMC Bioinformatics 2010, 11:221 http://www.biomedcentral.com/1471-2105/11/221 biological entities (i.e. >1 gene or transcript or exon) are i<strong>de</strong>ntified. The probes that are transcript-specific or exon-specific are provi<strong>de</strong>d in a link ("Probes ... specific" link) to another page that inclu<strong>de</strong>s the list of corresponding Ensembl ENST or ENSE IDs. The "Expression view" provi<strong>de</strong>s the expression profile of the queried gene in a set of different organs, tissues or cell types (Su et al. 2004 dataset [6]) and shows the expression signal per probe for each of the probes assigned to this gene locus or the global expression signal as log2 of the mean of all probes. We provi<strong>de</strong> an example to facilitate the use of the <strong>de</strong>scribed views and tools inclu<strong>de</strong>d in GATExplorer: human gene MEST (meso<strong>de</strong>rm-specific transcript homolog genes, Ensembl ENSG00000106484). This gene is located on chromosome 7 and its locus is 20.08 Kbp long. It has 4 transcripts and 16 exons. It is mapped by 175 distinct Affymetrix probes, which are inclu<strong>de</strong>d amonst 9 different microarray platforms. In the case of array HGU133 plus 2, 11 probes map to this gene, which correspond to Affymetrix probeset 202016_at. This probeset does not inclu<strong>de</strong> any "transcript-specific probe" because all probes map to the 4 known transcripts. For this gene the highest expression measured corresponds to bone marrow samples. Utility and discussion Mapping genes, transcripts and exons: coverage and efficiency Accurate expression <strong>de</strong>termination requires that microarray probes have minimal cross-hybridization with other genes or other transcribed entities. The GATExplorer database inclu<strong>de</strong>s <strong>de</strong>tailed information regarding the coverage and efficiency of the probe mapping (Tables 1, 2). Coverage is <strong>de</strong>fined as the proportion (i.e. %) of gene loci or transcripts from the total genes/transcripts of the Ensembl genomes (human, mouse or rat) that are mapped by the probes of a given microarray. Efficiency is <strong>de</strong>fined as the proportion (%) of probes from the total probes of a given microarray that map to Ensembl genes or transcripts. The term "unique mapped" refers to those gene loci or transcripts that are targeted by a set of probes of a given microarray that do not cross-hybridize (i.e. map unambiguously) with any other known gene loci or transcript. The quantity and percentage of human gene loci and transcripts targeted by the most wi<strong>de</strong>ly used human Affymetrix expression microarrays based on 3' expression (U133A and U133 Plus 2.0) and the new all-exon arrays (Gene 1.0 and Exon 1.0) is summarized in Table 1. The data shows that the Gene 1.0 and Exon 1.0 arrays achieve the highest coverage over gene loci: 82.57% and 95.82%, respectively (mapping to a total of 27184 human genes, obtained from genome assembly Ensembl v53 NCBI36). Such coverage (which <strong>de</strong>pends on the quality of the Page 5 of 12 genome annotation) has improved with respect to previous array mo<strong>de</strong>ls; for example, U133A shows 55.36% coverage of the current Ensembl genes. The transcript coverage also improves in the newer mo<strong>de</strong>ls (mapping to a total of 53024 human transcripts, obtained from the same genome assembly). However, the coverage <strong>de</strong>creases when "unique mapped" genes or transcripts are consi<strong>de</strong>red. For example, in the case of the human Gene 1.0 array, 73.29% of the genes are mapped by unique sets of probes. In any case, the overall coverage to measure expression from most human gene loci has improved by 27%, from U133A (55%) to Gene 1.0 (82%). With respect to the efficiency of the probe mapping, Table 2 presents the number and percentage of distinct probes in each microarray (i.e. probes of distinct sequence) that map to one or more transcripts or gene loci, for the most commonly used human microarray mo<strong>de</strong>ls. Therefore, the columns with >1 inclu<strong>de</strong> the probes that map to more than one transcript or gene locus. Those probes that map to several transcripts or loci, can be consi<strong>de</strong>red "ambiguous" probes. The figures show that the best mapping efficiency (88.41%) is obtained with the Gene 1.0 array. For the U133A array, 78.86% of the probes map to known gene loci of the current human genome version (Ensembl v53 NCBI36). The mapping efficiency <strong>de</strong>creases even further, to 74.5% (180188/241898), when only probes that hybridize to one gene locus are consi<strong>de</strong>red (e.g. 180188 probes for U133A). Therefore, probe mappings to human cDNA show that a significant portion (5.54% for U133A and 7.44% for Gene 1.0) hybridize "ambiguously" to more than one gene locus. A larger percentage of probes (55.40% for U133A and 45.55% for Gene 1.0) can hybridize to more than one transcript. Therefore, only a certain percentage of probes can be regar<strong>de</strong>d as gene-specific or transcript-specific. As a general conclusion, these calculations indicate that a significant proportion of probes (about 20 to 25% when mapping genes with U133A) can produce noise using standard expression signal calculations based on the probesets assigned by Affymetrix. The <strong>de</strong>scribed problem is also present in the new Exon 1.0 arrays, which show the lowest efficiency with only 25.5% of the probes mapping to known genes. This apparently low efficiency is not contradictory with a newly manufactured array, because the Exon 1.0 arrays have been <strong>de</strong>signed with a different goal to previous gene expression arrays, which was not just to cover known genes, but to be able to distinguish the expression of each exon in a given locus. To achieve this goal, the array inclu<strong>de</strong>s a complex collection of exon probes that correspond to five types of probesets based on different <strong>de</strong>grees of evi<strong>de</strong>nce: core, exten<strong>de</strong>d, full, ambiguous and free. Descriptions of each of these probesets can be found in the Affymetrix white paper on the Exon arrays (called
- Page 1:
Bioinformática aplicada a estudios
- Page 5 and 6:
Índice INTRODUCCIÓN GENERAL .....
- Page 7 and 8:
Introducción general Bioinformáti
- Page 9 and 10:
Figura 2. Proceso de transcripción
- Page 11 and 12:
Introducción general caciones, las
- Page 13 and 14:
Objetivos Introducción general La
- Page 15 and 16:
Capítulo 1 1.1.1. Bases de datos d
- Page 17 and 18:
Capítulo 1 sondas core y su inform
- Page 19 and 20:
caaatgacttgctattattgatggc 225 694 c
- Page 21 and 22:
presentes en el fichero. Capítulo
- Page 23 and 24:
Capítulo 1 Mus musculus MG_U74Av2
- Page 25 and 26:
Capítulo 1 Figura 1.5. Representac
- Page 27 and 28:
Capítulo 1 Paso 2 Descripción: As
- Page 29 and 30:
Capítulo 1 A la hora de escribir e
- Page 31 and 32:
Capítulo 1 en regiones no codifica
- Page 33 and 34:
Capítulo 1 Para optimizar la preci
- Page 35 and 36:
Figura 1.9a. Distribución del núm
- Page 37 and 38:
Capítulo 1 por contraste el númer
- Page 39 and 40:
Capítulo 1 (cromosoma, locus, exon
- Page 41 and 42:
Capítulo 1 figura 1.16). Además d
- Page 43 and 44:
Capítulo 1 exhaustivo en este ámb
- Page 45 and 46:
Capítulo 1 su presentación y deta
- Page 47:
Capítulo 1 adaptación para los mi
- Page 50 and 51:
Tesis Doctoral pueden agrupar en: t
- Page 52 and 53:
Tesis Doctoral enfermedad a través
- Page 54 and 55:
Tesis Doctoral los genes encontrado
- Page 56 and 57:
Tesis Doctoral real (RT-‐PCR).
- Page 58 and 59:
Tesis Doctoral muestras (ver figura
- Page 60 and 61:
Tesis Doctoral subtipo fueron: 0.97
- Page 62 and 63:
Tesis Doctoral En este trabajo se h
- Page 64 and 65:
Tesis Doctoral permitiría, sin dud
- Page 66 and 67:
Tesis Doctoral inclusión entre 0 y
- Page 68 and 69:
Tesis Doctoral exacto del número d
- Page 70 and 71:
Tesis Doctoral Los valores extremos
- Page 72 and 73:
Tesis Doctoral dicho, la comparaci
- Page 74 and 75: Tesis Doctoral 70 Figura 3.6. Los d
- Page 76 and 77: Tesis Doctoral 3.8.b). Sin embargo
- Page 78 and 79: Tesis Doctoral Human Exon 1.0. La l
- Page 80 and 81: Tesis Doctoral 76 Figura 3.10. Curv
- Page 82 and 83: Tesis Doctoral 78 Figura 3.10 (cont
- Page 84 and 85: Tesis Doctoral del inicio del ranki
- Page 87 and 88: Capítulo 4 Análisis de coexpresi
- Page 89 and 90: Capítulo 4 los genes y la perspect
- Page 91 and 92: Capítulo 4 Utilizando el set de da
- Page 93 and 94: ENSG00000142541 RPL13A small nucleo
- Page 95 and 96: Capítulo 4 Para encontrar los gene
- Page 97 and 98: Capítulo 4 ENSG00000134287 ARF3 AD
- Page 99 and 100: Capítulo 4 Figura 4.3. Red de coex
- Page 101 and 102: Capítulo 4 Si analizamos los genes
- Page 103 and 104: Capítulo 4 se hizo comparando cont
- Page 105: 4.4. Discusión y posible trabajo f
- Page 108 and 109: Tesis Doctoral exones, y diseñando
- Page 110 and 111: Tesis Doctoral expression and isofo
- Page 112 and 113: Tesis Doctoral 37, e107. Gardina, P
- Page 114 and 115: Tesis Doctoral and survival in chro
- Page 116 and 117: Tesis Doctoral Roth, R.B., Hevezi,
- Page 118 and 119: Tesis Doctoral Xi, L., Feber, A., G
- Page 121 and 122: Risueño et al. BMC Bioinformatics
- Page 123: Risueño et al. BMC Bioinformatics
- Page 127 and 128: Risueño et al. BMC Bioinformatics
- Page 129 and 130: Risueño et al. BMC Bioinformatics
- Page 131 and 132: Risueño et al. BMC Bioinformatics
- Page 133 and 134: ORIGINAL ARTICLE Deregulation of mi
- Page 135 and 136: Targets component of miRecords inte
- Page 137 and 138: log 10 2-ΔCt -2.00 -4.00 -6.00 -8.
- Page 139 and 140: Table 4 Potential microRNA (miRNA)-
- Page 141 and 142: myeloma pathogenesis. Proc Natl Aca
- Page 143 and 144: genetic subtypes of CLL show differ
- Page 145 and 146: Table 2. Cont. Up-regulated Down-re
- Page 147 and 148: 206 underexpressed in the 13q-H gro
- Page 149 and 150: Table 3. Most significant target ge
- Page 151 and 152: Discussion 13q deletion (13q-) is t
- Page 153 and 154: patients with 17p and 11q deletions
- Page 155 and 156: Human Gene Coexpression Landscape:
- Page 157 and 158: The similarity and proximity of the
- Page 159 and 160: As described in Methods we use a co
- Page 161 and 162: all data points of coexpression pai
- Page 163 and 164: Table 1. This work (2008) Pathway N
- Page 165 and 166: In conclusion, the functional consi
- Page 167 and 168: a total set of 48 microarrays. The
- Page 169 and 170: original article Annals of Oncology
- Page 171 and 172: Annals of Oncology original article
- Page 173 and 174: Annals of Oncology original article
- Page 175 and 176:
Annals of Oncology original article