

Alberto Risueño Pérez - Gredos - Universidad de Salamanca
Alberto Risueño Pérez - Gredos - Universidad de Salamanca
Alberto Risueño Pérez - Gredos - Universidad de Salamanca

Create successful ePaper yourself
Turn your PDF publications into a flip-book with our unique Google optimized e-Paper software.
<strong>Risueño</strong> et al. BMC Bioinformatics 2010, 11:221<br />
http://www.biomedcentral.com/1471-2105/11/221<br />
or by GeneMapper); (7) total number of mouse genes<br />
assigned within the microarray; (8) percentage of significant<br />
genes with respect to the total.<br />
The highest ranked statistical value among the four<br />
comparisons is highlighted in yellow (although, it is<br />
important to note that the highest statistical rank does<br />
not imply the most biologically relevant change). In four<br />
out of five cases (IRS2, NRAS, SCD1 and ENG) the newly<br />
calculated gene mapping provi<strong>de</strong>s a better rank than the<br />
standard mapping, according to the statistical significance<br />
of the differential expression of the KO gene. The<br />
number of genes with q-value < 0.10 (which indicates the<br />
extension of the significant change) was the largest with<br />
the newly calculated gene mapping for two KO genes:<br />
APOE, 9.29% changed genes; NRAS, 0.28% changed<br />
genes. Finally, the p-value of the statistical test was lowest<br />
with the new mapping for KO genes ENG and IRS2. The<br />
results consistently indicate that the method using CDFs<br />
with the new remapping to "genes" provi<strong>de</strong>s at least as<br />
significant changes as the best of the three methods based<br />
on Affymetrix "probesets" CDFs.<br />
We emphasize that the purpose of these analyses is not<br />
to propose a new algorithm, but rather to <strong>de</strong>termine in a<br />
comparative approach whether the array probe remappings<br />
provi<strong>de</strong> results that are at least of equal quality to<br />
the original probesets. A complete evaluation of the<br />
methods will need a <strong>de</strong>ep biological and functional analysis<br />
of the results that goes beyond the scope of this paper.<br />
To facilitate further analysis and in<strong>de</strong>pen<strong>de</strong>nt comparison,<br />
we provi<strong>de</strong> in the website the raw datasets (CEL files)<br />
corresponding to the results presented in Figure 3. More-<br />
Page 8 of 12<br />
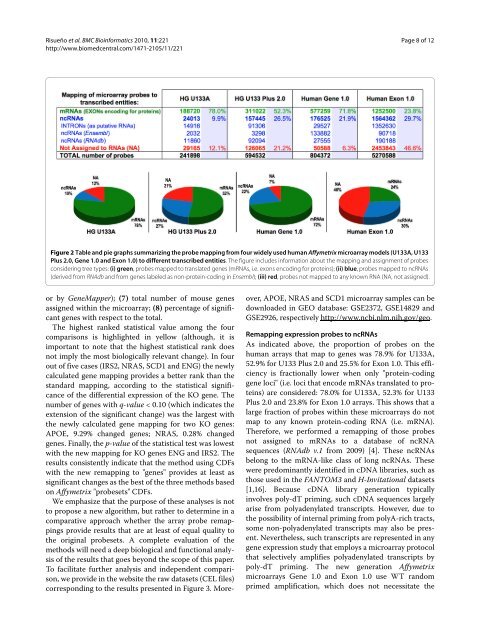
Figure 2 Table and pie graphs summarizing the probe mapping from four wi<strong>de</strong>ly used human Affymetrix microarray mo<strong>de</strong>ls (U133A, U133<br />
Plus 2.0, Gene 1.0 and Exon 1.0) to different transcribed entities. The figure inclu<strong>de</strong>s information about the mapping and assignment of probes<br />
consi<strong>de</strong>ring tree types: (i) green, probes mapped to translated genes (mRNAs, i.e. exons encoding for proteins); (ii) blue, probes mapped to ncRNAs<br />
(<strong>de</strong>rived from RNAdb and from genes labeled as non-protein-coding in Ensembl); (iii) red, probes not mapped to any known RNA (NA, not assigned).<br />
over, APOE, NRAS and SCD1 microarray samples can be<br />
downloa<strong>de</strong>d in GEO database: GSE2372, GSE14829 and<br />
GSE2926, respectively http://www.ncbi.nlm.nih.gov/geo.<br />
Remapping expression probes to ncRNAs<br />
As indicated above, the proportion of probes on the<br />
human arrays that map to genes was 78.9% for U133A,<br />
52.9% for U133 Plus 2.0 and 25.5% for Exon 1.0. This efficiency<br />
is fractionally lower when only "protein-coding<br />
gene loci" (i.e. loci that enco<strong>de</strong> mRNAs translated to proteins)<br />
are consi<strong>de</strong>red: 78.0% for U133A, 52.3% for U133<br />
Plus 2.0 and 23.8% for Exon 1.0 arrays. This shows that a<br />
large fraction of probes within these microarrays do not<br />
map to any known protein-coding RNA (i.e. mRNA).<br />
Therefore, we performed a remapping of those probes<br />
not assigned to mRNAs to a database of ncRNA<br />
sequences (RNAdb v.1 from 2009) [4]. These ncRNAs<br />
belong to the mRNA-like class of long ncRNAs. These<br />
were predominantly i<strong>de</strong>ntified in cDNA libraries, such as<br />
those used in the FANTOM3 and H-Invitational datasets<br />
[1,16]. Because cDNA library generation typically<br />
involves poly-dT priming, such cDNA sequences largely<br />
arise from polya<strong>de</strong>nylated transcripts. However, due to<br />
the possibility of internal priming from polyA-rich tracts,<br />
some non-polya<strong>de</strong>nylated transcripts may also be present.<br />
Nevertheless, such transcripts are represented in any<br />
gene expression study that employs a microarray protocol<br />
that selectively amplifies polya<strong>de</strong>nylated transcripts by<br />
poly-dT priming. The new generation Affymetrix<br />
microarrays Gene 1.0 and Exon 1.0 use WT random<br />
primed amplification, which does not necessitate the


