Alberto Risueño Pérez - Gredos - Universidad de Salamanca
Alberto Risueño Pérez - Gredos - Universidad de Salamanca
Alberto Risueño Pérez - Gredos - Universidad de Salamanca
You also want an ePaper? Increase the reach of your titles
YUMPU automatically turns print PDFs into web optimized ePapers that Google loves.
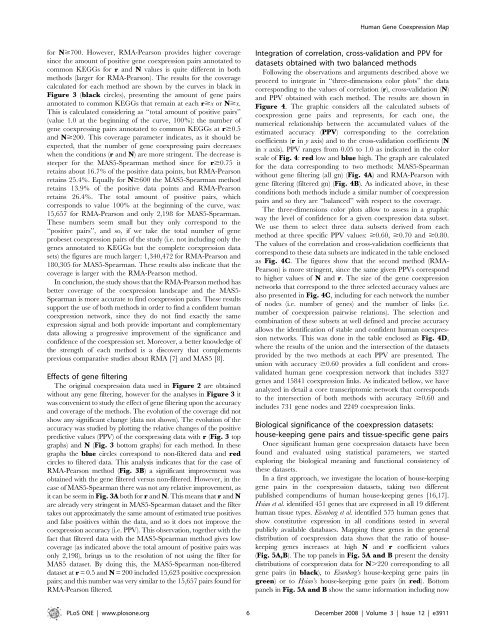
for N$700. However, RMA-Pearson provi<strong>de</strong>s higher coverage<br />
since the amount of positive gene coexpression pairs annotated to<br />
common KEGGs for r and N values is quite different in both<br />
methods (larger for RMA-Pearson). The results for the coverage<br />
calculated for each method are shown by the curves in black in<br />
Figure 3 (black circles), presenting the amount of gene pairs<br />
annotated to common KEGGs that remain at each r$x or N$x.<br />
This is calculated consi<strong>de</strong>ring as ‘‘total amount of positive pairs’’<br />
(value 1.0 at the beginning of the curve, 100%): the number of<br />
gene coexpressing pairs annotated to common KEGGs at r$0.5<br />
and N$200. This coverage parameter indicates, as it should be<br />
expected, that the number of gene coexpressing pairs <strong>de</strong>creases<br />
when the conditions (r and N) are more stringent. The <strong>de</strong>crease is<br />
steeper for the MAS5-Spearman method since for r$0.75 it<br />
retains about 16.7% of the positive data points, but RMA-Pearson<br />
retains 25.4%. Equally for N$600 the MAS5-Spearman method<br />
retains 13.9% of the positive data points and RMA-Pearson<br />
retains 26.4%. The total amount of positive pairs, which<br />
corresponds to value 100% at the beginning of the curve, was:<br />
15,657 for RMA-Pearson and only 2,198 for MAS5-Spearman.<br />
These numbers seem small but they only correspond to the<br />
‘‘positive pairs’’, and so, if we take the total number of gene<br />
probeset coexpression pairs of the study (i.e. not including only the<br />
genes annotated to KEGGs but the complete coexpression data<br />
sets) the figures are much larger: 1,340,472 for RMA-Pearson and<br />
180,305 for MAS5-Spearman. These results also indicate that the<br />
coverage is larger with the RMA-Pearson method.<br />
In conclusion, the study shows that the RMA-Pearson method has<br />
better coverage of the coexpression landscape and the MAS5-<br />
Spearman is more accurate to find coexpression pairs. These results<br />
support the use of both methods in or<strong>de</strong>r to find a confi<strong>de</strong>nt human<br />
coexpression network, since they do not find exactly the same<br />
expression signal and both provi<strong>de</strong> important and complementary<br />
data allowing a progressive improvement of the significance and<br />
confi<strong>de</strong>nce of the coexpression set. Moreover, a better knowledge of<br />
the strength of each method is a discovery that complements<br />
previous comparative studies about RMA [7] and MAS5 [8].<br />
Effects of gene filtering<br />
The original coexpression data used in Figure 2 are obtained<br />
without any gene filtering, however for the analyses in Figure 3 it<br />
was convenient to study the effect of gene filtering upon the accuracy<br />
and coverage of the methods. The evolution of the coverage did not<br />
show any significant change (data not shown). The evolution of the<br />
accuracy was studied by plotting the relative changes of the positive<br />
predictive values (PPV) of the coexpressing data with r (Fig. 3 top<br />
graphs) and N (Fig. 3 bottom graphs) for each method. In these<br />
graphs the blue circles correspond to non-filtered data and red<br />
circles to filtered data. This analysis indicates that for the case of<br />
RMA-Pearson method (Fig. 3B) a significant improvement was<br />
obtained with the gene filtered versus non-filtered. However, in the<br />
case of MAS5-Spearman there was not any relative improvement, as<br />
it can be seem in Fig. 3A both for r and N. This means that r and N<br />
are already very stringent in MAS5-Spearman dataset and the filter<br />
takes out approximately the same amount of estimated true positives<br />
and false positives within the data, and so it does not improve the<br />
coexpression accuracy (i.e. PPV). This observation, together with the<br />
fact that filtered data with the MAS5-Spearman method gives low<br />
coverage (as indicated above the total amount of positive pairs was<br />
only 2,198), brings us to the resolution of not using the filter for<br />
MAS5 dataset. By doing this, the MAS5-Spearman non-filtered<br />
dataset at r = 0.5 and N = 200 inclu<strong>de</strong>d 15,623 positive coexpression<br />
pairs; and this number was very similar to the 15,657 pairs found for<br />
RMA-Pearson filtered.<br />
Human Gene Coexpression Map<br />
Integration of correlation, cross-validation and PPV for<br />
datasets obtained with two balanced methods<br />
Following the observations and arguments <strong>de</strong>scribed above we<br />
proceed to integrate in ‘‘three-dimensions color plots’’ the data<br />
corresponding to the values of correlation (r), cross-validation (N)<br />
and PPV obtained with each method. The results are shown in<br />
Figure 4. The graphic consi<strong>de</strong>rs all the calculated subsets of<br />
coexpression gene pairs and represents, for each one, the<br />
numerical relationship between the accumulated values of the<br />
estimated accuracy (PPV) corresponding to the correlation<br />
coefficients (r in y axis) and to the cross-validation coefficients (N<br />
in x axis). PPV ranges from 0.05 to 1.0 as indicated in the color<br />
scale of Fig. 4: red low and blue high. The graph are calculated<br />
for the data corresponding to two methods: MAS5-Spearman<br />
without gene filtering (all gn) (Fig. 4A) and RMA-Pearson with<br />
gene filtering (filtered gn) (Fig. 4B). As indicated above, in these<br />
conditions both methods inclu<strong>de</strong> a similar number of coexpression<br />
pairs and so they are ‘‘balanced’’ with respect to the coverage.<br />
The three-dimensions color plots allow to assess in a graphic<br />
way the level of confi<strong>de</strong>nce for a given coexpression data subset.<br />
We use them to select three data subsets <strong>de</strong>rived from each<br />
method at three specific PPV values: $0.60, $0.70 and $0.80.<br />
The values of the correlation and cross-validation coefficients that<br />
correspond to these data subsets are indicated in the table enclosed<br />
as Fig. 4C. The figures show that the second method (RMA-<br />
Pearson) is more stringent, since the same given PPVs correspond<br />
to higher values of N and r. The size of the gene coexpression<br />
networks that correspond to the three selected accuracy values are<br />
also presented in Fig. 4C, including for each network the number<br />
of no<strong>de</strong>s (i.e. number of genes) and the number of links (i.e.<br />
number of coexpression pairwise relations). The selection and<br />
combination of these subsets at well <strong>de</strong>fined and precise accuracy<br />
allows the i<strong>de</strong>ntification of stable and confi<strong>de</strong>nt human coexpression<br />
networks. This was done in the table enclosed as Fig. 4D,<br />
where the results of the union and the intersection of the datasets<br />
provi<strong>de</strong>d by the two methods at each PPV are presented. The<br />
union with accuracy $0.60 provi<strong>de</strong>s a full confi<strong>de</strong>nt and crossvalidated<br />
human gene coexpression network that inclu<strong>de</strong>s 3327<br />
genes and 15841 coexpression links. As indicated bellow, we have<br />
analyzed in <strong>de</strong>tail a core transcriptomic network that corresponds<br />
to the intersection of both methods with accuracy $0.60 and<br />
inclu<strong>de</strong>s 731 gene no<strong>de</strong>s and 2249 coexpression links.<br />
Biological significance of the coexpression datasets:<br />
house-keeping gene pairs and tissue-specific gene pairs<br />
Once significant human gene coexpression datasets have been<br />
found and evaluated using statistical parameters, we started<br />
exploring the biological meaning and functional consistency of<br />
these datasets.<br />
In a first approach, we investigate the location of house-keeping<br />
gene pairs in the coexpression datasets, taking two different<br />
published compendiums of human house-keeping genes [16,17].<br />
Hsiao et al. i<strong>de</strong>ntified 451 genes that are expressed in all 19 different<br />
human tissue types. Eisenberg et al. i<strong>de</strong>ntified 575 human genes that<br />
show constitutive expression in all conditions tested in several<br />
publicly available databases. Mapping these genes in the general<br />
distribution of coexpression data shows that the ratio of housekeeping<br />
genes increases at high N and r coefficient values<br />
(Fig. 5A,B). The top panels in Fig. 5A and B present the <strong>de</strong>nsity<br />
distributions of coexpression data for N.220 corresponding to all<br />
gene pairs (in black), to Eisenberg’s house-keeping gene pairs (in<br />
green) ortoHsiao’s house-keeping gene pairs (in red). Bottom<br />
panels in Fig. 5A and B show the same information including now<br />
PLoS ONE | www.plosone.org 6 December 2008 | Volume 3 | Issue 12 | e3911


