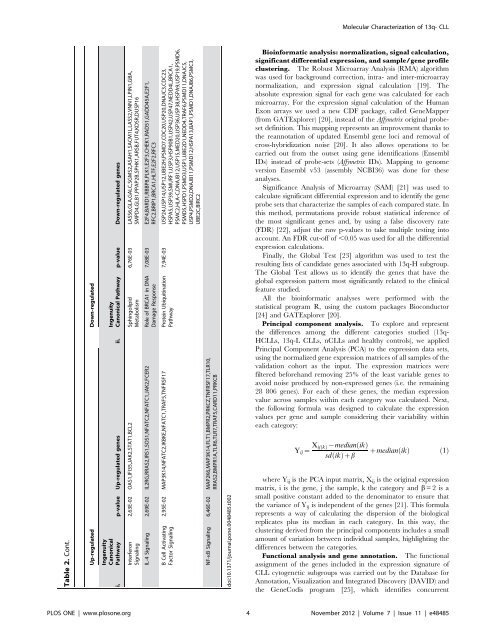
Table 2. Enriched functional analysis of the 3450 genes differentially expressed between the two 13q- patient subgroups: 1244 genes were upregulated (i) and 2206 genes were downregulated (ii) in CLL patients with $80% cells displaying 13q <strong>de</strong>letion. Up-regulated Down-regulated Ingenuity Canonical Pathway p-value Down-regulated genes Ingenuity Canonical Pathway p-value Up-regulated genes ii. i. 1,35E-05 KIF23,CDC25C,ESPL1,CDC20,PPP2CA,PRC1,CDC7 (inclu<strong>de</strong>s EG:12545), CCNB2,CDC23,PLK1,PPP2R5A,CDK1,CCNB1,SLK,HSP90B1,PLK4, PKMYT1,PPP2R1B,KIF11,CDC27,CDC25A Mitotic Roles of Polo-Like Kinase EIF2 Signaling 1,70E-07 RPL24,RPL27A,RPL26,RPS11,RPS27,RPS3A,SOS1,RPL35, RPL19,RPL13,RPL39L,RPL34,RPL27,RPL21,RPS19,RPL23A, RPS29,RPL36,RRAS2,RPS13,RPL26L1,RPL32,RPS25,RPS15A, RPL13A,RPS27A,RPL41,RPS14,RPSA 2,75E-05 MCM6,CDC45,CDT1,CDC6,CDC7 (inclu<strong>de</strong>s EG:12545),CDK6,ORC6, MCM4,MCM3,MCM2,CDK2,MCM7,ORC1 Cell Cycle Control of Chromosomal Replication 1,95E-05 MAP2K6,BLNK,MAP3K14,MAP3K9,CD19,CD79B,BAD, POU2F2,IKBKE,NFATC1,FCGR2B,PTEN,MAP3K12,RRAS2, CAMK2D,SYK,SOS1,CD22,NFATC2,PIK3AP1,PPP3CA,PRKCB B Cell Receptor Signaling 6,17E-04 FYN,ITGA2B,ITSN1,RAB5A,ACTB,COPA,ITGA6,ITGA5,COPB1,ACTG1, COPG,COPB2,DYRK3,ITGB2,ITGAE,ITGAM,ITGA9,ITGAV,HLA-C,ITGA4 Caveolar-mediated Endocytosis Signaling 6,92E-05 BLNK,CD19,CD79B,IKBKE,NFATC1,FCGR2B,PRKCZ, PTEN,BLK,CAMK2D,RRAS2,CD180,SYK,IRS1,SH2B2, NFATC2,PIK3AP1,PPP3CA,PRKCB PI3K Signaling in B Lymphocytes 7,94E-04 PGK1,ALDH4A1,PGM2,PKLR,GAPDH,PGM1,BPGM,PDHA1,HK1,ALDH2, GPI,HK2,ALDH1A1,DHRS9,ENO1,DLAT,DLD,FBP1,ALDH3B1,LDHA,ACSL1 Glycolysis/ Gluconeogenesis 2,75E-03 MAP2K6,MAP3K12,MAP3K9,MAP3K14,CD70,IKBKE, TRAF5,CD27,MAP2K5 CD27 Signaling in Lymphocytes Integrin Signaling 1,12E-04 RAP2B,RAF1,FYN,ITGA2B,ARHGAP26,TSPAN7,PIK3R1,PIK3R5,PPP1CB,NCK1, SHC1,ITGAE,PARVB,ARF6,WASL,RHOG,ITGA9,ARF4,PIK3CG,RHOU, ITGAV,VCL,MAP2K1,ACTN1,ITGA4,PXN,NRAS,ASAP1,CRKL,ACTB,ITGA6, TSPAN2,ITGA5,ACTG1,ITGB2,ARF1,ITGAM,TLN2,ZYX,PIK3CB,ACTN4,CTTN mTOR Signaling 5,37E-03 VEGFB,RHOC,RPS19,RPS11,PRKCZ,RPS29,RPS27,RPS3A, RRAS2,RPS13,IRS1,GPLD1,RPS15A,RPS25,GNB1L, RPS27A,RPS14,RPSA,PRKCB 1,17E-03 RAF1,E2F4,CCNE2,TFDP1,HDAC2,PPP2CA,SUV39H1,CDK6,CDKN2C, CCNB2,E2F3,PPP2R5A,CDK1,CCNB1,CCNA2,CCNE1,E2F1,PPP2R1B,E2F2, CDK2,CDC25A 6,76E-03 BLNK,IL2RG,RRAS2,IRS1,SYK,SH2B2,JAK2,STAT1,IL7 Cyclins and Cell Cycle Regulation Role of JAK1 and JAK3 in cc Cytokine Signaling 1,32E-03 CDC25C,E2F4,E2F1,RFC2,E2F3,BRCA1,CDK1,E2F2,CDK2,CDC25A, CHEK1,RFC3 1,20E-02 ERCC4,ERCC1,GTF2H1,ERCC2,MNAT1,XPA Role of CHK Proteins in Cell Cycle Checkpoint Control Nucleoti<strong>de</strong> Excision Repair Pathway 1,66E-03 DAPK1,PRKCQ,SGK1,MAPK6,CSNK1A1,CDK6,CSNK1D,PLK1,TTK,CDK1, SACM1L,VNN1,NEK2,ARAF,GRK6,PRKAA1,PNP,CD38,HIPK1,MAP2K1, NMNAT3,CDK2,BST1,DUSP16 Nicotinate and Nicotinami<strong>de</strong> Metabolism 1,66E-02 RPS19,RPS11,PRKCZ,RPS29,RPS27,RRAS2,RPS3A,RPS13, IRS1,SOS1,RPS25,RPS15A,RPS27A,RPS14,RPSA Regulation of eIF4 and p70S6K Signaling Molecular Characterization of 13q- CLL 1,78E-03 MINPP1,SGK1,PIK3R1,PIK3R5,CSNK1A1,TTK,OCRL,NEK2,PIK3CG,PRKAA1, PLCB1,IMPA2,PI4K2B,HIPK1,MAP2K1,PMPCA,MTMR3,DAPK1,IMPA1, PRKCQ,MTMR14,MAPK6,CDK6,CSNK1D,PLK1,CDK1,ARAF,SYNJ1, GRK6,PIK3CB,CDK2 PLOS ONE | www.plosone.org 3 November 2012 | Volume 7 | Issue 11 | e48485 Inositol Phosphate Metabolism 1,86E-02 BLNK,PEBP1,CD79B,RHOC,MEF2A,HDAC9,NFATC1,FCGR2B, MYL6B,PRKCZ,RRAS2,SYK,SOS1,GPLD1,NFATC2,MEF2C, GNB1L,ARHGEF9,PPP3CA,PRKCB Phospholipase C Signaling 4,57E-03 CCNE2,E2F4,CCNE1,PPP2CA,E2F1,E2F3,PPP2R1B,CCRN4L, E2F2,CDK2,PPP2R5A Cell Cycle Regulation by BTG Family Proteins 1,86E-02 MAP3K12,MAP3K9,MAP3K14,POU2F1,RRAS2,CAMK2D, SOS1,NFATC2,IKBKE,NFATC1,CARD11,PPP3CA PKCh Signaling in T Lymphocytes 6,61E-03 AP2A1,STON2,PIK3R1,PIK3R5,PDGFC,VEGFA,ARF6,ARRB1,WASL,SNX9, PIK3CG,DAB2,CSNK2B,AAK1,AP2M1,RAB5A,ACTB,CHP,CLTC,RAB7A, ITGA5,ACTG1,TSG101,ITGB2,ARRB2,LDLR,SYNJ1,TFRC,PIK3CB,DNM1L,CTTN 2,34E-02 MAP3K14,NFATC2,IKBKE,NFATC1,TRAF5,TNFRSF17 Clathrin-mediated Endocytosis Signaling April Mediated Signaling
Table 2. Cont. Up-regulated Down-regulated Ingenuity Canonical Pathway p-value Down-regulated genes Ingenuity Canonical Pathway p-value Up-regulated genes ii. i. 6,76E-03 LASS6,GLA,GALC,SGMS2,ASAH1,SACM1L,LASS2,VNN1,LPIN1,GBA, SMPD4,GLB1,PPAP2B,SPHK1,ARSB,FUT4,KDSR,DUSP16 2,63E-02 OAS1,IFI35,JAK2,STAT1,BCL2 Sphingolipid Metabolism Interferon Signaling 7,08E-03 E2F4,BARD1,RBBP8,PLK1,E2F3,CHEK1,RAD51,GADD45A,E2F1, RFC2,BRIP1,BRCA1,HLTF,E2F2,RFC3 IL-4 Signaling 2,69E-02 IL2RG,RRAS2,IRS1,SOS1,NFATC2,NFATC1,JAK2,FCER2 Role of BRCA1 in DNA Damage Response 7,94E-03 USP24,USP14,USP12,UBE2H,PSMD7,CDC20,USP20,DNAJC3,CDC23, HSPA5,USP39,SMURF1,USP3,HSP90B1,USP42,USP47,NEDD4L,BRCA1, PSMC2,HLA-C,DNAJB12,USP15,MED20,USP36,USP38,HSPA9,USP19,PSMD6, PSMD5,HSPD1,PSMD3,USP1,UBE2D1,NEDD4,TRAF6,PSMD11,DNAJC5, USP4,PSMD2,DNAJB11,PSMD12,HSPA13,BAP1,PSMD1,DNAJB6,PSMC3, UBE2C,BIRC2 2,95E-02 MAP3K14,NFATC2,IKBKE,NFATC1,TRAF5,TNFRSF17 Protein Ubiquitination Pathway B Cell Activating Factor Signaling NF-kB Signaling 6,46E-02 MAP2K6,MAP3K14,FLT1,BMPR2,PRKCZ,TNFRSF17,TLR10, RRAS2,BMPR1A,TLR6,TLR7,TRAF5,CARD11,PRKCB doi:10.1371/journal.pone.0048485.t002 Bioinformatic analysis: normalization, signal calculation, significant differential expression, and sample/gene profile clustering. The Robust Microarray Analysis (RMA) algorithm was used for background correction, intra- and inter-microarray normalization, and expression signal calculation [19]. The absolute expression signal for each gene was calculated for each microarray. For the expression signal calculation of the Human Exon arrays we used a new CDF package, called GeneMapper (from GATExplorer) [20], instead of the Affymetrix original probeset <strong>de</strong>finition. This mapping represents an improvement thanks to the reannotation of updated Ensembl gene loci and removal of cross-hybridization noise [20]. It also allows operations to be carried out from the outset using gene i<strong>de</strong>ntifications (Ensembl IDs) instead of probe-sets (Affymetrix IDs). Mapping to genome version Ensembl v53 (assembly NCBI36) was done for these analyses. Significance Analysis of Microarray (SAM) [21] was used to calculate significant differential expression and to i<strong>de</strong>ntify the gene probe sets that characterize the samples of each compared state. In this method, permutations provi<strong>de</strong> robust statistical inference of the most significant genes and, by using a false discovery rate (FDR) [22], adjust the raw p-values to take multiple testing into account. An FDR cut-off of ,0.05 was used for all the differential expression calculations. Finally, the Global Test [23] algorithm was used to test the resulting lists of candidate genes associated with 13q-H subgroup. The Global Test allows us to i<strong>de</strong>ntify the genes that have the global expression pattern most significantly related to the clinical feature studied. All the bioinformatic analyses were performed with the statistical program R, using the custom packages Bioconductor [24] and GATExplorer [20]. Principal component analysis. To explore and represent the differences among the different categories studied (13q- HCLLs, 13q-L CLLs, nCLLs and healthy controls), we applied Principal Component Analysis (PCA) to the expression data sets, using the normalized gene expression matrices of all samples of the validation cohort as the input. The expression matrices were filtered beforehand removing 25% of the least variable genes to avoid noise produced by non-expressed genes (i.e. the remaining 28 806 genes). For each of these genes, the median expression value across samples within each category was calculated. Next, the following formula was <strong>de</strong>signed to calculate the expression values per gene and sample consi<strong>de</strong>ring their variability within each category: Yij~ XijðkÞ{medianðikÞ sdðikÞzb Molecular Characterization of 13q- CLL zmedianðikÞ ð1Þ where Yij is the PCA input matrix, Xij is the original expression matrix, i is the gene, j the sample, k the category and b = 2 is a small positive constant ad<strong>de</strong>d to the <strong>de</strong>nominator to ensure that the variance of Yij is in<strong>de</strong>pen<strong>de</strong>nt of the genes [21]. This formula represents a way of calculating the dispersion of the biological replicates plus its median in each category. In this way, the clustering <strong>de</strong>rived from the principal components inclu<strong>de</strong>s a small amount of variation between individual samples, highlighting the differences between the categories. Functional analysis and gene annotation. The functional assignment of the genes inclu<strong>de</strong>d in the expression signature of CLL cytogenetic subgroups was carried out by the Database for Annotation, Visualization and Integrated Discovery (DAVID) and the GeneCodis program [25], which i<strong>de</strong>ntifies concurrent PLOS ONE | www.plosone.org 4 November 2012 | Volume 7 | Issue 11 | e48485
- Page 1:
Bioinformática aplicada a estudios
- Page 5 and 6:
Índice INTRODUCCIÓN GENERAL .....
- Page 7 and 8:
Introducción general Bioinformáti
- Page 9 and 10:
Figura 2. Proceso de transcripción
- Page 11 and 12:
Introducción general caciones, las
- Page 13 and 14:
Objetivos Introducción general La
- Page 15 and 16:
Capítulo 1 1.1.1. Bases de datos d
- Page 17 and 18:
Capítulo 1 sondas core y su inform
- Page 19 and 20:
caaatgacttgctattattgatggc 225 694 c
- Page 21 and 22:
presentes en el fichero. Capítulo
- Page 23 and 24:
Capítulo 1 Mus musculus MG_U74Av2
- Page 25 and 26:
Capítulo 1 Figura 1.5. Representac
- Page 27 and 28:
Capítulo 1 Paso 2 Descripción: As
- Page 29 and 30:
Capítulo 1 A la hora de escribir e
- Page 31 and 32:
Capítulo 1 en regiones no codifica
- Page 33 and 34:
Capítulo 1 Para optimizar la preci
- Page 35 and 36:
Figura 1.9a. Distribución del núm
- Page 37 and 38:
Capítulo 1 por contraste el númer
- Page 39 and 40:
Capítulo 1 (cromosoma, locus, exon
- Page 41 and 42:
Capítulo 1 figura 1.16). Además d
- Page 43 and 44:
Capítulo 1 exhaustivo en este ámb
- Page 45 and 46:
Capítulo 1 su presentación y deta
- Page 47:
Capítulo 1 adaptación para los mi
- Page 50 and 51:
Tesis Doctoral pueden agrupar en: t
- Page 52 and 53:
Tesis Doctoral enfermedad a través
- Page 54 and 55:
Tesis Doctoral los genes encontrado
- Page 56 and 57:
Tesis Doctoral real (RT-‐PCR).
- Page 58 and 59:
Tesis Doctoral muestras (ver figura
- Page 60 and 61:
Tesis Doctoral subtipo fueron: 0.97
- Page 62 and 63:
Tesis Doctoral En este trabajo se h
- Page 64 and 65:
Tesis Doctoral permitiría, sin dud
- Page 66 and 67:
Tesis Doctoral inclusión entre 0 y
- Page 68 and 69:
Tesis Doctoral exacto del número d
- Page 70 and 71:
Tesis Doctoral Los valores extremos
- Page 72 and 73:
Tesis Doctoral dicho, la comparaci
- Page 74 and 75:
Tesis Doctoral 70 Figura 3.6. Los d
- Page 76 and 77:
Tesis Doctoral 3.8.b). Sin embargo
- Page 78 and 79:
Tesis Doctoral Human Exon 1.0. La l
- Page 80 and 81:
Tesis Doctoral 76 Figura 3.10. Curv
- Page 82 and 83:
Tesis Doctoral 78 Figura 3.10 (cont
- Page 84 and 85:
Tesis Doctoral del inicio del ranki
- Page 87 and 88:
Capítulo 4 Análisis de coexpresi
- Page 89 and 90:
Capítulo 4 los genes y la perspect
- Page 91 and 92:
Capítulo 4 Utilizando el set de da
- Page 93 and 94: ENSG00000142541 RPL13A small nucleo
- Page 95 and 96: Capítulo 4 Para encontrar los gene
- Page 97 and 98: Capítulo 4 ENSG00000134287 ARF3 AD
- Page 99 and 100: Capítulo 4 Figura 4.3. Red de coex
- Page 101 and 102: Capítulo 4 Si analizamos los genes
- Page 103 and 104: Capítulo 4 se hizo comparando cont
- Page 105: 4.4. Discusión y posible trabajo f
- Page 108 and 109: Tesis Doctoral exones, y diseñando
- Page 110 and 111: Tesis Doctoral expression and isofo
- Page 112 and 113: Tesis Doctoral 37, e107. Gardina, P
- Page 114 and 115: Tesis Doctoral and survival in chro
- Page 116 and 117: Tesis Doctoral Roth, R.B., Hevezi,
- Page 118 and 119: Tesis Doctoral Xi, L., Feber, A., G
- Page 121 and 122: Risueño et al. BMC Bioinformatics
- Page 123 and 124: Risueño et al. BMC Bioinformatics
- Page 125 and 126: Risueño et al. BMC Bioinformatics
- Page 127 and 128: Risueño et al. BMC Bioinformatics
- Page 129 and 130: Risueño et al. BMC Bioinformatics
- Page 131 and 132: Risueño et al. BMC Bioinformatics
- Page 133 and 134: ORIGINAL ARTICLE Deregulation of mi
- Page 135 and 136: Targets component of miRecords inte
- Page 137 and 138: log 10 2-ΔCt -2.00 -4.00 -6.00 -8.
- Page 139 and 140: Table 4 Potential microRNA (miRNA)-
- Page 141 and 142: myeloma pathogenesis. Proc Natl Aca
- Page 143: genetic subtypes of CLL show differ
- Page 147 and 148: 206 underexpressed in the 13q-H gro
- Page 149 and 150: Table 3. Most significant target ge
- Page 151 and 152: Discussion 13q deletion (13q-) is t
- Page 153 and 154: patients with 17p and 11q deletions
- Page 155 and 156: Human Gene Coexpression Landscape:
- Page 157 and 158: The similarity and proximity of the
- Page 159 and 160: As described in Methods we use a co
- Page 161 and 162: all data points of coexpression pai
- Page 163 and 164: Table 1. This work (2008) Pathway N
- Page 165 and 166: In conclusion, the functional consi
- Page 167 and 168: a total set of 48 microarrays. The
- Page 169 and 170: original article Annals of Oncology
- Page 171 and 172: Annals of Oncology original article
- Page 173 and 174: Annals of Oncology original article
- Page 175 and 176: Annals of Oncology original article