

Alberto Risueño Pérez - Gredos - Universidad de Salamanca
Alberto Risueño Pérez - Gredos - Universidad de Salamanca
Alberto Risueño Pérez - Gredos - Universidad de Salamanca

Create successful ePaper yourself
Turn your PDF publications into a flip-book with our unique Google optimized e-Paper software.
Capítulo 1<br />
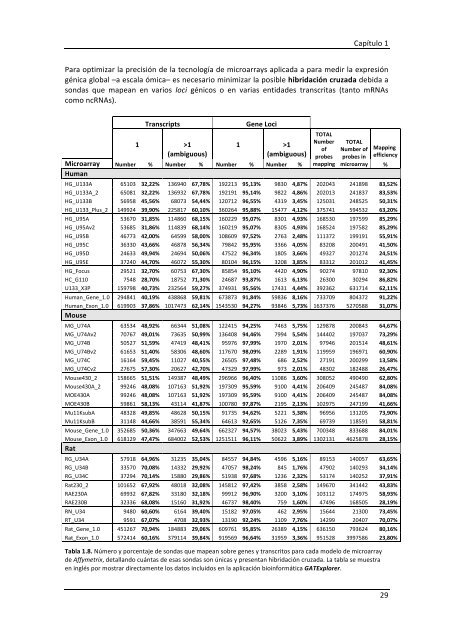
Para optimizar la precisión <strong>de</strong> la tecnología <strong>de</strong> microarrays aplicada a para medir la expresión<br />
génica global –a escala ómica– es necesario minimizar la posible hibridación cruzada <strong>de</strong>bida a<br />
sondas que mapean en varios loci génicos o en varias entida<strong>de</strong>s transcritas (tanto mRNAs<br />
como ncRNAs).<br />
Transcripts Gene Loci<br />
1 >1<br />
1 >1<br />
(ambiguous)<br />
(ambiguous)<br />
Microarray<br />
Human<br />
Number % Number % Number % Number %<br />
TOTAL<br />
Number<br />
of<br />
probes<br />
mapping<br />
TOTAL<br />
Number of Mapping<br />
probes in efficiency<br />
microarray %<br />
HG_U133A 65103 32,22% 136940 67,78% 192213 95,13% 9830 4,87% 202043 241898 83,52%<br />
HG_U133A_2 65081 32,22% 136932 67,78% 192191 95,14% 9822 4,86% 202013 241837 83,53%<br />
HG_U133B 56958 45,56% 68073 54,44% 120712 96,55% 4319 3,45% 125031 248525 50,31%<br />
HG_U133_Plus_2 149924 39,90% 225817 60,10% 360264 95,88% 15477 4,12% 375741 594532 63,20%<br />
HG_U95A 53670 31,85% 114860 68,15% 160229 95,07% 8301 4,93% 168530 197599 85,29%<br />
HG_U95Av2 53685 31,86% 114839 68,14% 160219 95,07% 8305 4,93% 168524 197582 85,29%<br />
HG_U95B 46773 42,00% 64599 58,00% 108609 97,52% 2763 2,48% 111372 199191 55,91%<br />
HG_U95C 36330 43,66% 46878 56,34% 79842 95,95% 3366 4,05% 83208 200491 41,50%<br />
HG_U95D 24633 49,94% 24694 50,06% 47522 96,34% 1805 3,66% 49327 201274 24,51%<br />
HG_U95E 37240 44,70% 46072 55,30% 80104 96,15% 3208 3,85% 83312 201012 41,45%<br />
HG_Focus 29521 32,70% 60753 67,30% 85854 95,10% 4420 4,90% 90274 97810 92,30%<br />
HC_G110 7548 28,70% 18752 71,30% 24687 93,87% 1613 6,13% 26300 30294 86,82%<br />
U133_X3P 159798 40,73% 232564 59,27% 374931 95,56% 17431 4,44% 392362 631714 62,11%<br />
Human_Gene_1.0 294841 40,19% 438868 59,81% 673873 91,84% 59836 8,16% 733709 804372 91,22%<br />
Human_Exon_1.0 619903 37,86% 1017473 62,14% 1543530 94,27% 93846 5,73% 1637376 5270588 31,07%<br />
Mouse<br />
MG_U74A 63534 48,92% 66344 51,08% 122415 94,25% 7463 5,75% 129878 200843 64,67%<br />
MG_U74Av2 70767 49,01% 73635 50,99% 136408 94,46% 7994 5,54% 144402 197037 73,29%<br />
MG_U74B 50527 51,59% 47419 48,41% 95976 97,99% 1970 2,01% 97946 201514 48,61%<br />
MG_U74Bv2 61653 51,40% 58306 48,60% 117670 98,09% 2289 1,91% 119959 196971 60,90%<br />
MG_U74C 16164 59,45% 11027 40,55% 26505 97,48% 686 2,52% 27191 200299 13,58%<br />
MG_U74Cv2 27675 57,30% 20627 42,70% 47329 97,99% 973 2,01% 48302 182488 26,47%<br />
Mouse430_2 158665 51,51% 149387 48,49% 296966 96,40% 11086 3,60% 308052 490490 62,80%<br />
Mouse430A_2 99246 48,08% 107163 51,92% 197309 95,59% 9100 4,41% 206409 245487 84,08%<br />
MOE430A 99246 48,08% 107163 51,92% 197309 95,59% 9100 4,41% 206409 245487 84,08%<br />
MOE430B 59861 58,13% 43114 41,87% 100780 97,87% 2195 2,13% 102975 247199 41,66%<br />
Mu11KsubA 48328 49,85% 48628 50,15% 91735 94,62% 5221 5,38% 96956 131205 73,90%<br />
Mu11KsubB 31148 44,66% 38591 55,34% 64613 92,65% 5126 7,35% 69739 118591 58,81%<br />
Mouse_Gene_1.0 352685 50,36% 347663 49,64% 662327 94,57% 38023 5,43% 700348 833688 84,01%<br />
Mouse_Exon_1.0 618129 47,47% 684002 52,53% 1251511 96,11% 50622 3,89% 1302131 4625878 28,15%<br />
Rat<br />
RG_U34A 57918 64,96% 31235 35,04% 84557 94,84% 4596 5,16% 89153 140057 63,65%<br />
RG_U34B 33570 70,08% 14332 29,92% 47057 98,24% 845 1,76% 47902 140293 34,14%<br />
RG_U34C 37294 70,14% 15880 29,86% 51938 97,68% 1236 2,32% 53174 140252 37,91%<br />
Rat230_2 101652 67,92% 48018 32,08% 145812 97,42% 3858 2,58% 149670 341442 43,83%<br />
RAE230A 69932 67,82% 33180 32,18% 99912 96,90% 3200 3,10% 103112 174975 58,93%<br />
RAE230B 32336 68,08% 15160 31,92% 46737 98,40% 759 1,60% 47496 168505 28,19%<br />
RN_U34 9480 60,60% 6164 39,40% 15182 97,05% 462 2,95% 15644 21300 73,45%<br />
RT_U34 9591 67,07% 4708 32,93% 13190 92,24% 1109 7,76% 14299 20407 70,07%<br />
Rat_Gene_1.0 451267 70,94% 184883 29,06% 609761 95,85% 26389 4,15% 636150 793624 80,16%<br />
Rat_Exon_1.0 572414 60,16% 379114 39,84% 919569 96,64% 31959 3,36% 951528 3997586 23,80%<br />
Tabla 1.8. Número y porcentaje <strong>de</strong> sondas que mapean sobre genes y transcritos para cada mo<strong>de</strong>lo <strong>de</strong> microarray<br />
<strong>de</strong> Affymetrix, <strong>de</strong>tallando cuántas <strong>de</strong> esas sondas son únicas y presentan hibridación cruzada. La tabla se muestra<br />
en inglés por mostrar directamente los datos incluidos en la aplicación bioinformática GATExplorer.<br />
29


