

Alberto Risueño Pérez - Gredos - Universidad de Salamanca
Alberto Risueño Pérez - Gredos - Universidad de Salamanca
Alberto Risueño Pérez - Gredos - Universidad de Salamanca

Create successful ePaper yourself
Turn your PDF publications into a flip-book with our unique Google optimized e-Paper software.
<strong>Risueño</strong> et al. BMC Bioinformatics 2010, 11:221<br />
http://www.biomedcentral.com/1471-2105/11/221<br />
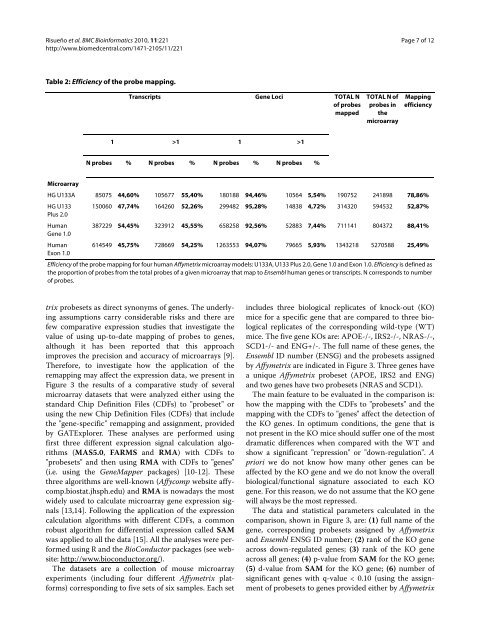
Table 2: Efficiency of the probe mapping.<br />
Transcripts Gene Loci TOTAL N<br />
of probes<br />
mapped<br />
1 >1 1 >1<br />
N probes % N probes % N probes % N probes %<br />
trix probesets as direct synonyms of genes. The un<strong>de</strong>rlying<br />
assumptions carry consi<strong>de</strong>rable risks and there are<br />
few comparative expression studies that investigate the<br />
value of using up-to-date mapping of probes to genes,<br />
although it has been reported that this approach<br />
improves the precision and accuracy of microarrays [9].<br />
Therefore, to investigate how the application of the<br />
remapping may affect the expression data, we present in<br />
Figure 3 the results of a comparative study of several<br />
microarray datasets that were analyzed either using the<br />
standard Chip Definition Files (CDFs) to "probeset" or<br />
using the new Chip Definition Files (CDFs) that inclu<strong>de</strong><br />
the "gene-specific" remapping and assignment, provi<strong>de</strong>d<br />
by GATExplorer. These analyses are performed using<br />
first three different expression signal calculation algorithms<br />
(MAS5.0, FARMS and RMA) with CDFs to<br />
"probesets" and then using RMA with CDFs to "genes"<br />
(i.e. using the GeneMapper packages) [10-12]. These<br />
three algorithms are well-known (Affycomp website affycomp.biostat.jhsph.edu)<br />
and RMA is nowadays the most<br />
wi<strong>de</strong>ly used to calculate microarray gene expression signals<br />
[13,14]. Following the application of the expression<br />
calculation algorithms with different CDFs, a common<br />
robust algorithm for differential expression called SAM<br />
was applied to all the data [15]. All the analyses were performed<br />
using R and the BioConductor packages (see website:<br />
http://www.bioconductor.org/).<br />
The datasets are a collection of mouse microarray<br />
experiments (including four different Affymetrix platforms)<br />
corresponding to five sets of six samples. Each set<br />
TOTAL N of<br />
probes in<br />
the<br />
microarray<br />
Page 7 of 12<br />
Mapping<br />
efficiency<br />
Microarray<br />
HG U133A 85075 44,60% 105677 55,40% 180188 94,46% 10564 5,54% 190752 241898 78,86%<br />
HG U133<br />
Plus 2.0<br />
150060 47,74% 164260 52,26% 299482 95,28% 14838 4,72% 314320 594532 52,87%<br />
Human<br />
Gene 1.0<br />
387229 54,45% 323912 45,55% 658258 92,56% 52883 7,44% 711141 804372 88,41%<br />
Human<br />
Exon 1.0<br />
614549 45,75% 728669 54,25% 1263553 94,07% 79665 5,93% 1343218 5270588 25,49%<br />
Efficiency of the probe mapping for four human Affymetrix microarray mo<strong>de</strong>ls: U133A, U133 Plus 2.0, Gene 1.0 and Exon 1.0. Efficiency is <strong>de</strong>fined as<br />
the proportion of probes from the total probes of a given microarray that map to Ensembl human genes or transcripts. N corresponds to number<br />
of probes.<br />
inclu<strong>de</strong>s three biological replicates of knock-out (KO)<br />
mice for a specific gene that are compared to three biological<br />
replicates of the corresponding wild-type (WT)<br />
mice. The five gene KOs are: APOE-/-, IRS2-/-, NRAS-/-,<br />
SCD1-/- and ENG+/-. The full name of these genes, the<br />
Ensembl ID number (ENSG) and the probesets assigned<br />
by Affymetrix are indicated in Figure 3. Three genes have<br />
a unique Affymetrix probeset (APOE, IRS2 and ENG)<br />
and two genes have two probesets (NRAS and SCD1).<br />
The main feature to be evaluated in the comparison is:<br />
how the mapping with the CDFs to "probesets" and the<br />
mapping with the CDFs to "genes" affect the <strong>de</strong>tection of<br />
the KO genes. In optimum conditions, the gene that is<br />
not present in the KO mice should suffer one of the most<br />
dramatic differences when compared with the WT and<br />
show a significant "repression" or "down-regulation". A<br />
priori we do not know how many other genes can be<br />
affected by the KO gene and we do not know the overall<br />
biological/functional signature associated to each KO<br />
gene. For this reason, we do not assume that the KO gene<br />
will always be the most repressed.<br />
The data and statistical parameters calculated in the<br />
comparison, shown in Figure 3, are: (1) full name of the<br />
gene, corresponding probesets assigned by Affymetrix<br />
and Ensembl ENSG ID number; (2) rank of the KO gene<br />
across down-regulated genes; (3) rank of the KO gene<br />
across all genes; (4) p-value from SAM for the KO gene;<br />
(5) d-value from SAM for the KO gene; (6) number of<br />
significant genes with q-value < 0.10 (using the assignment<br />
of probesets to genes provi<strong>de</strong>d either by Affymetrix


