

Alberto Risueño Pérez - Gredos - Universidad de Salamanca
Alberto Risueño Pérez - Gredos - Universidad de Salamanca
Alberto Risueño Pérez - Gredos - Universidad de Salamanca

Create successful ePaper yourself
Turn your PDF publications into a flip-book with our unique Google optimized e-Paper software.
634<br />
Leukemia<br />
respectively. Most of the predicted miRNA target genes for the<br />
miRNA characterizing MM with t(4;14) and MM with t(14;16)<br />
were assigned to the functional categories of cellular growth and<br />
proliferation: JUND, MYBL1, SOCS3, CCND2, SLC7A5 and<br />
IRAK1 upregulated in MM with t(4;14), and AKAP12, CREG1,<br />
EEF2K, IGFBP5, RASSF5, S1PR1, TFAP2C, WNT5A and CCND2<br />
upregulated in MM with t(14;16). This observation suggests a<br />
possible link between the miRNA downregulation in these MM<br />
subsets and an advantage in myeloma cell growth. The majority<br />
of candidate miRNA target genes inversely correlated with<br />
miRNA signature of MM with monosomy 13 were involved in<br />
cell <strong>de</strong>ath category in the functional analysis.<br />
Although the analysis strategy up to this point was based on<br />
target gene selection from at least five miRNA-target prediction<br />
programs and on a further inverse correlation, filters for<br />
discriminating those miRNA–mRNA interactions more susceptible<br />
to a <strong>de</strong>gradation process were not applied. Therefore, we<br />
carried out a final step in the bioinformatic analysis selecting<br />
stringent criteria filters from the combination of four programs,<br />
including criteria of seed region complementarity and UTR<br />
context, which greatly reduces false-positive predictions and<br />
provi<strong>de</strong> miRNA–mRNA interactions potentially more sensitive<br />
to a cleavage pathway. 20,30,34 The miRNA target genes selected<br />
using this more accurate analysis approach are shown in Tables<br />
3 and 4.<br />
A significant number of miRNAs are located within the<br />
intronic regions of either coding or non-coding transcription<br />
units. The expression of intronic miRNA is believed to be<br />
regulated by the expression of the host mRNA. 36 In this study,<br />
we selected the intronic miRNAs among the <strong>de</strong>regulated<br />
miRNAs, in or<strong>de</strong>r to investigate whether their host genes were<br />
also <strong>de</strong>regulated in the MM gene expression profile. However,<br />
we did not find any significant correlation between the intronic<br />
miRNAs and their host transcripts.<br />
Discussion<br />
In this study, a genome-wi<strong>de</strong> miRNA expression profiling on<br />
MM samples with different cytogenetic abnormalities was<br />
carried out. Our results show that the genetic subgroups in<br />
MM are associated with singular miRNA signatures. Supervised<br />
approaches i<strong>de</strong>ntified miRNA sets differentially expressed in the<br />
MM genetic groups, although not clearly separated clusters<br />
containing specific cytogenetic abnormalities were observed.<br />
The fact that genetic subgroups were not distinguishable in the<br />
miRNA clustering is in contrast to the studies in acute lymphoid<br />
and myeloid leukemias, wherein miRNA expression grouped<br />
samples according to the genetic rearrangements. It is possible<br />
that the complexity of the genetic portrait of myeloma cells<br />
with multiple associations of genetic abnormalities within the<br />
same cell as compared with that of myeloid and lymphoid<br />
blasts, may explain the inability to segregate MM cytogenetic<br />
subgroups by miRNA unsupervised clustering. 12,37,38 In fact,<br />
there is a strong association between the different genetic<br />
abnormalities in MM, particularly between t(4;14) and RB<br />
<strong>de</strong>letion and 1q gains. 1<br />
One of the most significant findings was the upregulation of<br />
miR-1 and miR-133a, belonging to a cluster at 18q11, in MM<br />
with t(14;16). These two miRNAs have distinct roles in modulating<br />
skeletal and cardiac muscle proliferation and differentiation,<br />
and their potential function in the MM with t(14;16) <strong>de</strong>serves<br />
further investigation. 39 With respect to the MM samples harboring<br />
RB <strong>de</strong>letion, the un<strong>de</strong>rexpression of miRNAs located in 13q<br />
would reflect a reduction in dosage of these miRNAs as a<br />
consequence of monosomy 13, since in most MM cases RB<br />
<strong>de</strong>letion <strong>de</strong>tected by FISH represents whole chromosome<br />
monosomy. This observation is in agreement with the haploinsufficiency<br />
of many of the genes mapped at chromosome 13,<br />
<strong>de</strong>monstrated by gene expression analysis. 40<br />
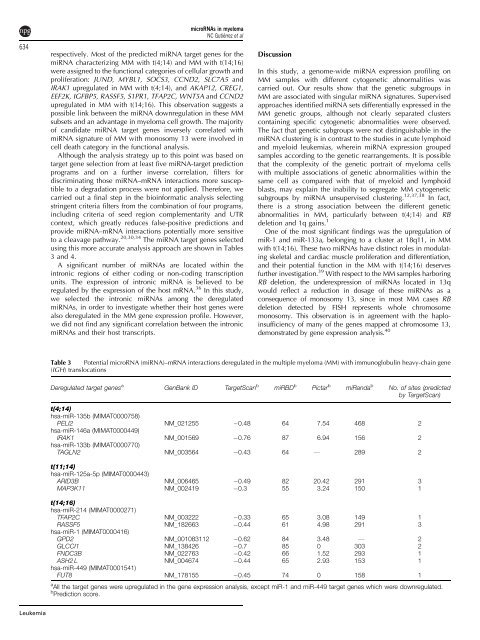
Table 3 Potential microRNA (miRNA)–mRNA interactions <strong>de</strong>regulated in the multiple myeloma (MM) with immunoglobulin heavy-chain gene<br />
(IGH) translocations<br />
Deregulated target genes a<br />
GenBank ID TargetScan b<br />
miRBD b<br />
Pictar b<br />
miRanda b<br />
No. of sites (predicted<br />
by TargetScan)<br />
t(4;14)<br />
hsa-miR-135b (MIMAT0000758)<br />
PELI2 NM_021255 0.48 64 7.54 468 2<br />
hsa-miR-146a (MIMAT0000449)<br />
IRAK1 NM_001569 0.76 87 6.94 156 2<br />
hsa-miR-133b (MIMAT0000770)<br />
TAGLN2 NM_003564 0.43 64 F 289 2<br />
t(11;14)<br />
hsa-miR-125a-5p (MIMAT0000443)<br />
ARID3B NM_006465 0.49 82 20.42 291 3<br />
MAP3K11 NM_002419 0.3 55 3.24 150 1<br />
t(14;16)<br />
hsa-miR-214 (MIMAT0000271)<br />
TFAP2C NM_003222 0.33 65 3.08 149 1<br />
RASSF5 NM_182663 0.44 61 4.98 291 3<br />
hsa-miR-1 (MIMAT0000416)<br />
GPD2 NM_001083112 0.62 84 3.48 F 2<br />
GLCCI1 NM_138426 0.7 85 0 303 2<br />
FNDC3B NM_022763 0.42 66 1.52 293 1<br />
ASH2 L NM_004674 0.44 65 2.93 153 1<br />
hsa-miR-449 (MIMAT0001541)<br />
FUT8 NM_178155 0.45 74 0 158 1<br />
a All the target genes were upregulated in the gene expression analysis, except miR-1 and miR-449 target genes which were downregulated.<br />
b Prediction score.<br />
microRNAs in myeloma<br />
NC Gutiérrez et al


