Alberto Risueño Pérez - Gredos - Universidad de Salamanca
Alberto Risueño Pérez - Gredos - Universidad de Salamanca
Alberto Risueño Pérez - Gredos - Universidad de Salamanca
You also want an ePaper? Increase the reach of your titles
YUMPU automatically turns print PDFs into web optimized ePapers that Google loves.
630<br />
Leukemia<br />
Cytogenetic analysis<br />
The selection of patients was based on cytogenetic features in<br />
or<strong>de</strong>r inclu<strong>de</strong> a representative number of samples with the most<br />
relevant and recurrent genetic abnormalities. The systematic<br />
screening for genomic aberrations in our institution inclu<strong>de</strong>s<br />
interphase fluorescence in situ hybridization studies for the<br />
<strong>de</strong>tection of IGH rearrangements, RB1 and P53 <strong>de</strong>letions<br />
(Abbott Molecular/Vysis, Des Plaines, IL, USA) as previously<br />
<strong>de</strong>scribed, 21 and 1q gains (ON 1q21/SRD 1p36, Kreatech<br />
Diagnostics, Amsterdam). Furthermore, only patients with more<br />
than 80% of PCs exhibiting genetic abnormalities were<br />
consi<strong>de</strong>red for the analysis, with the exception of gains on 1q<br />
and P53 <strong>de</strong>letions, which were present in a median of 77%<br />
(range, 28–100%) and 72% (range, 46–88%) of the PCs,<br />
respectively. The distribution of cytogenetic abnormalities in<br />
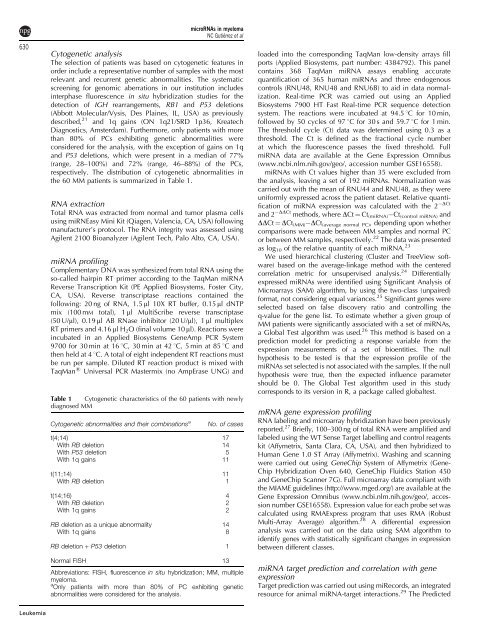
the 60 MM patients is summarized in Table 1.<br />
RNA extraction<br />
Total RNA was extracted from normal and tumor plasma cells<br />
using miRNEasy Mini Kit (Qiagen, Valencia, CA, USA) following<br />
manufacturer’s protocol. The RNA integrity was assessed using<br />
Agilent 2100 Bioanalyzer (Agilent Tech, Palo Alto, CA, USA).<br />
miRNA profiling<br />
Complementary DNA was synthesized from total RNA using the<br />
so-called hairpin RT primer according to the TaqMan miRNA<br />
Reverse Transcription Kit (PE Applied Biosystems, Foster City,<br />
CA, USA). Reverse transcriptase reactions contained the<br />
following: 20 ng of RNA, 1.5 ml 10X RT buffer, 0.15 ml dNTP<br />
mix (100 mM total), 1 ml MultiScribe reverse transcriptase<br />
(50 U/ml), 0.19 ml AB RNase inhibitor (20 U/ml), 1 ml multiplex<br />
RT primers and 4.16 mlH 2O (final volume 10 ml). Reactions were<br />
incubated in an Applied Biosystems GeneAmp PCR System<br />
9700 for 30 min at 16 1C, 30 min at 42 1C, 5 min at 85 1C and<br />
then held at 4 1C. A total of eight in<strong>de</strong>pen<strong>de</strong>nt RT reactions must<br />
be run per sample. Diluted RT reaction product is mixed with<br />
TaqMan s Universal PCR Mastermix (no AmpErase UNG) and<br />
Table 1 Cytogenetic characteristics of the 60 patients with newly<br />
diagnosed MM<br />
Cytogenetic abnormalities and their combinations a<br />
microRNAs in myeloma<br />
NC Gutiérrez et al<br />
No. of cases<br />
t(4;14) 17<br />
With RB <strong>de</strong>letion 14<br />
With P53 <strong>de</strong>letion 5<br />
With 1q gains 11<br />
t(11;14) 11<br />
With RB <strong>de</strong>letion 1<br />
t(14;16) 4<br />
With RB <strong>de</strong>letion 2<br />
With 1q gains 2<br />
RB <strong>de</strong>letion as a unique abnormality 14<br />
With 1q gains 8<br />
RB <strong>de</strong>letion + P53 <strong>de</strong>letion 1<br />
Normal FISH 13<br />
Abbreviations: FISH, fluorescence in situ hybridization; MM, multiple<br />
myeloma.<br />
a<br />
Only patients with more than 80% of PC exhibiting genetic<br />
abnormalities were consi<strong>de</strong>red for the analysis.<br />
loa<strong>de</strong>d into the corresponding TaqMan low-<strong>de</strong>nsity arrays fill<br />
ports (Applied Biosystems, part number: 4384792). This panel<br />
contains 368 TaqMan miRNA assays enabling accurate<br />
quantification of 365 human miRNAs and three endogenous<br />
controls (RNU48, RNU48 and RNU6B) to aid in data normalization.<br />
Real-time PCR was carried out using an Applied<br />
Biosystems 7900 HT Fast Real-time PCR sequence <strong>de</strong>tection<br />
system. The reactions were incubated at 94.5 1C for 10 min,<br />
followed by 50 cycles of 97 1C for 30 s and 59.7 1C for 1 min.<br />
The threshold cycle (Ct) data was <strong>de</strong>termined using 0.3 as a<br />
threshold. The Ct is <strong>de</strong>fined as the fractional cycle number<br />
at which the fluorescence passes the fixed threshold. Full<br />
miRNA data are available at the Gene Expression Omnibus<br />
(www.ncbi.nlm.nih.gov/geo/, accession number GSE16558).<br />
miRNAs with Ct values higher than 35 were exclu<strong>de</strong>d from<br />
the analysis, leaving a set of 192 miRNAs. Normalization was<br />
carried out with the mean of RNU44 and RNU48, as they were<br />
uniformly expressed across the patient dataset. Relative quantification<br />
of miRNA expression was calculated with the 2 DCt<br />
and 2 DDCt methods, where DCt ¼ Ct (miRNA) Ct (control miRNA) and<br />
DDCt ¼ DCt (MM) DCt (average normal PC), <strong>de</strong>pending upon whether<br />
comparisons were ma<strong>de</strong> between MM samples and normal PC<br />
or between MM samples, respectively. 22 The data was presented<br />
as log10 of the relative quantity of each miRNA. 23<br />
We used hierarchical clustering (Cluster and TreeView software)<br />
based on the average-linkage method with the centered<br />
correlation metric for unsupervised analysis. 24 Differentially<br />
expressed miRNAs were i<strong>de</strong>ntified using Significant Analysis of<br />
Microarrays (SAM) algorithm, by using the two-class (unpaired)<br />
format, not consi<strong>de</strong>ring equal variances. 25 Significant genes were<br />
selected based on false discovery ratio and controlling the<br />
q-value for the gene list. To estimate whether a given group of<br />
MM patients were significantly associated with a set of miRNAs,<br />
a Global Test algorithm was used. 26 This method is based on a<br />
prediction mo<strong>de</strong>l for predicting a response variable from the<br />
expression measurements of a set of bioentities. The null<br />
hypothesis to be tested is that the expression profile of the<br />
miRNAs set selected is not associated with the samples. If the null<br />
hypothesis were true, then the expected influence parameter<br />
should be 0. The Global Test algorithm used in this study<br />
corresponds to its version in R, a package called globaltest.<br />
mRNA gene expression profiling<br />
RNA labeling and microarray hybridization have been previously<br />
reported. 27 Briefly, 100–300 ng of total RNA were amplified and<br />
labeled using the WT Sense Target labelling and control reagents<br />
kit (Affymetrix, Santa Clara, CA, USA), and then hybridized to<br />
Human Gene 1.0 ST Array (Affymetrix). Washing and scanning<br />
were carried out using GeneChip System of Affymetrix (Gene-<br />
Chip Hybridization Oven 640, GeneChip Fluidics Station 450<br />
and GeneChip Scanner 7G). Full microarray data compliant with<br />
the MIAME gui<strong>de</strong>lines (http://www.mged.org/) are available at the<br />
Gene Expression Omnibus (www.ncbi.nlm.nih.gov/geo/, accession<br />
number GSE16558). Expression value for each probe set was<br />
calculated using RMAExpress program that uses RMA (Robust<br />
Multi-Array Average) algorithm. 28 A differential expression<br />
analysis was carried out on the data using SAM algorithm to<br />
i<strong>de</strong>ntify genes with statistically significant changes in expression<br />
between different classes.<br />
miRNA target prediction and correlation with gene<br />
expression<br />
Target prediction was carried out using miRecords, an integrated<br />
resource for animal miRNA-target interactions. 29 The Predicted


