

Alberto Risueño Pérez - Gredos - Universidad de Salamanca
Alberto Risueño Pérez - Gredos - Universidad de Salamanca
Alberto Risueño Pérez - Gredos - Universidad de Salamanca

You also want an ePaper? Increase the reach of your titles
YUMPU automatically turns print PDFs into web optimized ePapers that Google loves.
log 10 2-ΔCt<br />
-2.00<br />
-4.00<br />
-6.00<br />
-8.00<br />
miR-1<br />
MM with t (14;16) NPC<br />
and differentially expressed genes to discriminate only significant<br />
<strong>de</strong>regulated genes that are putative targets of the miRNAs<br />
associated to MM. Finally, we carried out a statistical correlation<br />
analysis between the raw expression levels of the MM<strong>de</strong>regulated<br />
miRNAs and the MM-<strong>de</strong>regulated target genes<br />
log 10 2-ΔCt<br />
-2.00<br />
-4.00<br />
-6.00<br />
-8.00<br />
MM with t (14;16)<br />
miR-133a<br />
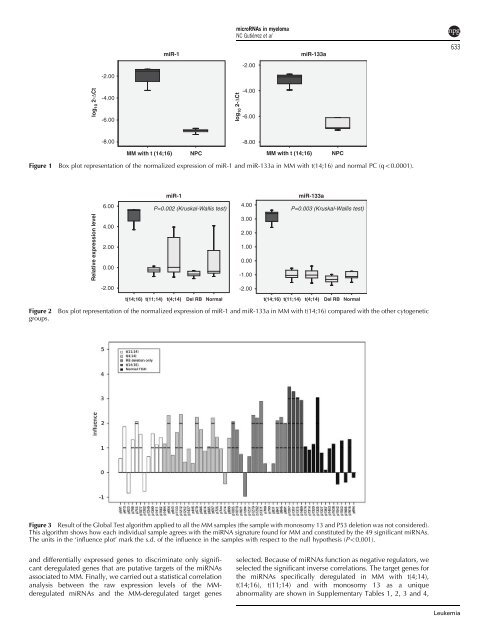
Figure 1 Box plot representation of the normalized expression of miR-1 and miR-133a in MM with t(14;16) and normal PC (qo0.0001).<br />
Relative expression level<br />
6.00<br />
4.00<br />
2.00<br />
0.00<br />
-2.00<br />
t(14;16) t(11;14)<br />
miR-1<br />
P=0.002 (Kruskal-Wallis test)<br />
t(4;14)<br />
Del RB<br />
Normal<br />
microRNAs in myeloma<br />
NC Gutiérrez et al<br />
4.00<br />
3.00<br />
2.00<br />
1.00<br />
0.00<br />
-1.00<br />
-2.00<br />
t(14;16) t(11;14)<br />
miR-133a<br />
t(4;14)<br />
NPC<br />
P=0.003 (Kruskal-Wallis test)<br />
Figure 2 Box plot representation of the normalized expression of miR-1 and miR-133a in MM with t(14;16) compared with the other cytogenetic<br />
groups.<br />
Figure 3 Result of the Global Test algorithm applied to all the MM samples (the sample with monosomy 13 and P53 <strong>de</strong>letion was not consi<strong>de</strong>red).<br />
This algorithm shows how each individual sample agrees with the miRNA signature found for MM and constituted by the 49 significant miRNAs.<br />
The units in the ‘influence plot’ mark the s.d. of the influence in the samples with respect to the null hypothesis (Po0.001).<br />
Del RB<br />
Normal<br />
selected. Because of miRNAs function as negative regulators, we<br />
selected the significant inverse correlations. The target genes for<br />
the miRNAs specifically <strong>de</strong>regulated in MM with t(4;14),<br />
t(14;16), t(11;14) and with monosomy 13 as a unique<br />
abnormality are shown in Supplementary Tables 1, 2, 3 and 4,<br />
633<br />
Leukemia


