

Alberto Risueño Pérez - Gredos - Universidad de Salamanca
Alberto Risueño Pérez - Gredos - Universidad de Salamanca
Alberto Risueño Pérez - Gredos - Universidad de Salamanca

Create successful ePaper yourself
Turn your PDF publications into a flip-book with our unique Google optimized e-Paper software.
how a normal-healthy human cellular system works, and they<br />
cannot be used to draw a reliable map of the human gene<br />
coexpression landscape.<br />
The technical noise in the genome-wi<strong>de</strong> expression microarray<br />
studies is another well reported problem that can not be ignored<br />
when gene coexpression studies at ‘‘omic’’ scale are un<strong>de</strong>rtaken.<br />
Consi<strong>de</strong>ring all these problems and knowing the interest of having<br />
a reliable normal human gene coexpression network, we have<br />
un<strong>de</strong>rtaken this task selecting human genome-wi<strong>de</strong> expression<br />
microarrays from a controlled set of different normal tissues to<br />
build a confi<strong>de</strong>nt human transcriptomic network using several<br />
statistical and computational methods. These methods (which<br />
inclu<strong>de</strong> robust data normalization and signal calculation, combined<br />
parametric and non-parametric correlation and random<br />
cross-validation) help to avoid both biological and technical noise<br />
and provi<strong>de</strong> a human gene coexpression network that shows good<br />
accuracy and coverage. Moreover, the network reveals well<br />
<strong>de</strong>fined biological functions and pathways that map to specific<br />
coexpression clusters.<br />
Results and Discussion<br />
Genome-wi<strong>de</strong> expression profiles from a broad set of<br />
human samples<br />
An expression matrix was calculated for a dataset of human<br />
genome-wi<strong>de</strong> microarrays hybridized with mRNA samples<br />
coming from different human tissues, glands and organs from<br />
healthy normal individuals. As indicated in Materials and<br />
Methods the dataset inclu<strong>de</strong>d two biological replicates of samples<br />
from 24 parts of the body: adrenal gland, appendix, blood, bone marrow,<br />
Human Gene Coexpression Map<br />
brain, kidney, liver, lung, lymph no<strong>de</strong>, muscle heart, ovary, pancreas, pituitary<br />
gland, prostate gland, salivary gland, skin, spinal cord, testis, thymus gland,<br />
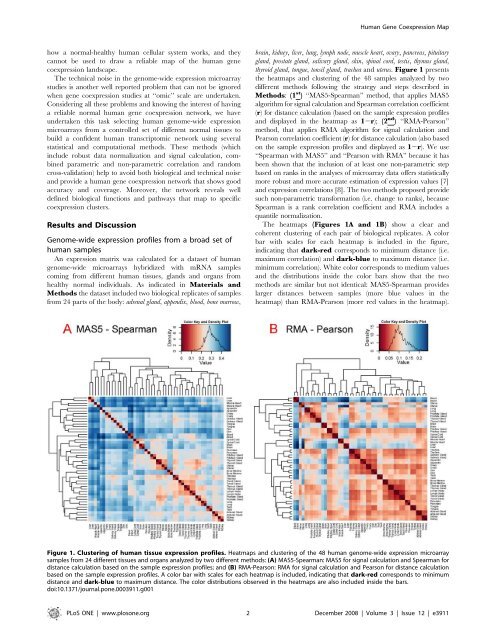
thyroid gland, tongue, tonsil gland, trachea and uterus. Figure 1 presents<br />
the heatmaps and clustering of the 48 samples analyzed by two<br />
different methods following the strategy and steps <strong>de</strong>scribed in<br />
Methods: (1 st ) ‘‘MAS5-Spearman’’ method, that applies MAS5<br />
algorithm for signal calculation and Spearman correlation coefficient<br />
(r) for distance calculation (based on the sample expression profiles<br />
and displayed in the heatmap as 12r); (2 nd ) ‘‘RMA-Pearson’’<br />
method, that applies RMA algorithm for signal calculation and<br />
Pearson correlation coefficient (r) for distance calculation (also based<br />
on the sample expression profiles and displayed as 12r). We use<br />
‘‘Spearman with MAS5’’ and ‘‘Pearson with RMA’’ because it has<br />
been shown that the inclusion of at least one non-parametric step<br />
based on ranks in the analyses of microarray data offers statistically<br />
more robust and more accurate estimation of expression values [7]<br />
and expression correlations [8]. The two methods proposed provi<strong>de</strong><br />
such non-parametric transformation (i.e. change to ranks), because<br />
Spearman is a rank correlation coefficient and RMA inclu<strong>de</strong>s a<br />
quantile normalization.<br />
The heatmaps (Figures 1A and 1B) show a clear and<br />
coherent clustering of each pair of biological replicates. A color<br />
bar with scales for each heatmap is inclu<strong>de</strong>d in the figure,<br />
indicating that dark-red corresponds to minimum distance (i.e.<br />
maximum correlation) and dark-blue to maximum distance (i.e.<br />
minimum correlation). White color corresponds to medium values<br />
and the distributions insi<strong>de</strong> the color bars show that the two<br />
methods are similar but not i<strong>de</strong>ntical: MAS5-Spearman provi<strong>de</strong>s<br />
larger distances between samples (more blue values in the<br />
heatmap) than RMA-Pearson (more red values in the heatmap).<br />
Figure 1. Clustering of human tissue expression profiles. Heatmaps and clustering of the 48 human genome-wi<strong>de</strong> expression microarray<br />
samples from 24 different tissues and organs analyzed by two different methods: (A) MAS5-Spearman: MAS5 for signal calculation and Spearman for<br />
distance calculation based on the sample expression profiles; and (B) RMA-Pearson: RMA for signal calculation and Pearson for distance calculation<br />
based on the sample expression profiles. A color bar with scales for each heatmap is inclu<strong>de</strong>d, indicating that dark-red corresponds to minimum<br />
distance and dark-blue to maximum distance. The color distributions observed in the heatmaps are also inclu<strong>de</strong>d insi<strong>de</strong> the bars.<br />
doi:10.1371/journal.pone.0003911.g001<br />
PLoS ONE | www.plosone.org 2 December 2008 | Volume 3 | Issue 12 | e3911


