

Alberto Risueño Pérez - Gredos - Universidad de Salamanca
Alberto Risueño Pérez - Gredos - Universidad de Salamanca
Alberto Risueño Pérez - Gredos - Universidad de Salamanca

Create successful ePaper yourself
Turn your PDF publications into a flip-book with our unique Google optimized e-Paper software.
Table 2.<br />
No<strong>de</strong>s 1<br />
Links 2<br />
TP 3<br />
All 4<br />
PPV 5<br />
This work (2008) 3052 12669 729 1189 0.613<br />
Lee et al. (2004) 1751 12187 1275 2265 0.563<br />
Griffith et al. (2005) 2922 12686 1265 2588 0.489<br />
1<br />
Nu of genes as no<strong>de</strong>s in the network (the values correspond to the full<br />
networks including all genes).<br />
2<br />
Nu of coexpression links (the values correspond to the full networks including<br />
all links).<br />
3<br />
True Positives = gene-pairs that coexpress and are annotated to the same<br />
KEGG.<br />
4<br />
All the genes that coexpress and are annotated to KEGG.<br />
5<br />
Accuracy as PPVs that correspond to the networks <strong>de</strong>rived for KEGG annotated<br />
genes.<br />
doi:10.1371/journal.pone.0003911.t002<br />
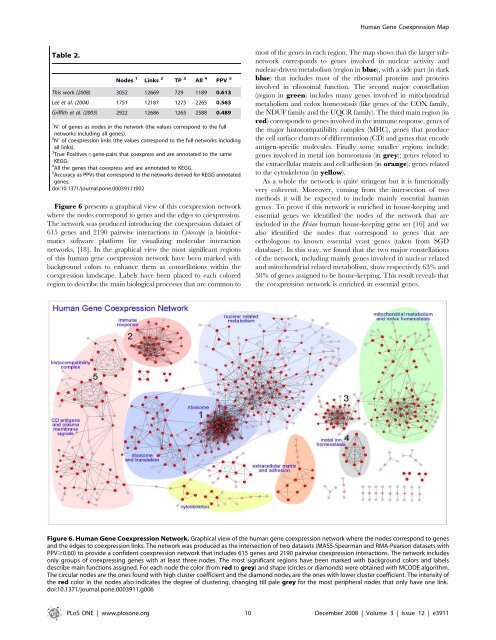
Figure 6 presents a graphical view of this coexpression network<br />
where the no<strong>de</strong>s correspond to genes and the edges to coexpression.<br />
The network was produced introducing the coexpression dataset of<br />
615 genes and 2190 pairwise interactions in Cytoscape (a bioinformatics<br />
software platform for visualizing molecular interaction<br />
networks, [18]. In the graphical view the most significant regions<br />
of this human gene coexpression network have been marked with<br />
background colors to enhance them as constellations within the<br />
coexpression landscape. Labels have been placed to each colored<br />
region to <strong>de</strong>scribe the main biological processes that are common to<br />
Human Gene Coexpression Map<br />
most of the genes in each region. The map shows that the larger subnetwork<br />
corresponds to genes involved in nuclear activity and<br />
nuclear-driven metabolism (region in blue), with a si<strong>de</strong> part (in dark<br />
blue) that inclu<strong>de</strong>s most of the ribosomal proteins and proteins<br />
involved in ribosomal function. The second major constellation<br />
(region in green) inclu<strong>de</strong>s many genes involved in mitochondrial<br />
metabolism and redox homeostasis (like genes of the COX family,<br />
theNDUFfamilyandtheUQCRfamily).Thethirdmainregion(in<br />
red) corresponds to genes involved in the immune response, genes of<br />
the major histocompatibility complex (MHC), genes that produce<br />
the cell surface clusters of differentiation (CD) and genes that enco<strong>de</strong><br />
antigen-specific molecules. Finally some smaller regions inclu<strong>de</strong>:<br />
genes involved in metal ion homeostasis (in grey); genes related to<br />
the extracellular matrix and cell adhesion (in orange); genes related<br />
to the cytoskeleton (in yellow).<br />
As a whole the network is quite stringent but it is functionally<br />
very coherent. Moreover, coming from the intersection of two<br />
methods it will be expected to inclu<strong>de</strong> mainly essential human<br />
genes. To prove if this network is enriched in house-keeping and<br />
essential genes we i<strong>de</strong>ntified the no<strong>de</strong>s of the network that are<br />
inclu<strong>de</strong>d in the Hsiao human house-keeping gene set [16] and we<br />
also i<strong>de</strong>ntified the no<strong>de</strong>s that correspond to genes that are<br />
orthologous to known essential yeast genes (taken from SGD<br />
database). In this way, we found that the two major constellations<br />
of the network, including mainly genes involved in nuclear related<br />
and mitochondrial related metabolism, show respectively 63% and<br />
58% of genes assigned to be house-keeping. This result reveals that<br />
the coexpression network is enriched in essential genes.<br />
Figure 6. Human Gene Coexpression Network. Graphical view of the human gene coexpression network where the no<strong>de</strong>s correspond to genes<br />
and the edges to coexpression links. The network was produced as the intersection of two datasets (MAS5-Spearman and RMA-Pearson datasets with<br />
PPV$0.60) to provi<strong>de</strong> a confi<strong>de</strong>nt coexpression network that inclu<strong>de</strong>s 615 genes and 2190 pairwise coexpression interactions. The network inclu<strong>de</strong>s<br />
only groups of coexpressing genes with at least three no<strong>de</strong>s. The most significant regions have been marked with background colors and labels<br />
<strong>de</strong>scribe main functions assigned. For each no<strong>de</strong> the color (from red to grey) and shape (circles or diamonds) were obtained with MCODE algorithm.<br />
The circular no<strong>de</strong>s are the ones found with high cluster coefficient and the diamond no<strong>de</strong>s are the ones with lower cluster coefficient. The intensity of<br />
the red color in the no<strong>de</strong>s also indicates the <strong>de</strong>gree of clustering, changing till pale grey for the most peripheral no<strong>de</strong>s that only have one link.<br />
doi:10.1371/journal.pone.0003911.g006<br />
PLoS ONE | www.plosone.org 10 December 2008 | Volume 3 | Issue 12 | e3911


