

Alberto Risueño Pérez - Gredos - Universidad de Salamanca
Alberto Risueño Pérez - Gredos - Universidad de Salamanca
Alberto Risueño Pérez - Gredos - Universidad de Salamanca

Create successful ePaper yourself
Turn your PDF publications into a flip-book with our unique Google optimized e-Paper software.
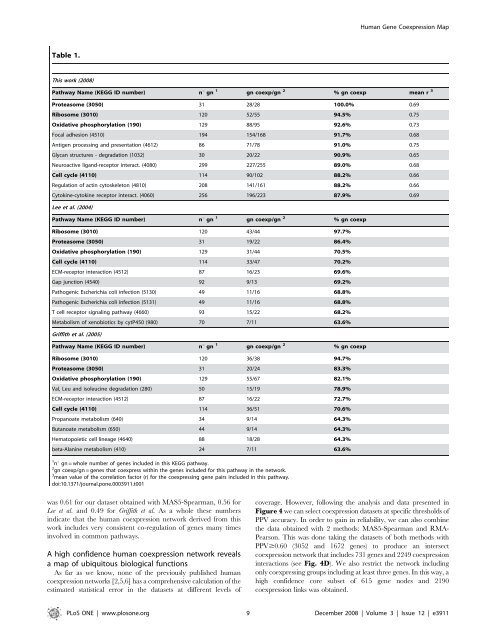
Table 1.<br />
This work (2008)<br />
Pathway Name (KEGG ID number) nu gn 1<br />
was 0.61 for our dataset obtained with MAS5-Spearman, 0.56 for<br />
Lee et al. and 0.49 for Griffith et al. As a whole these numbers<br />
indicate that the human coexpression network <strong>de</strong>rived from this<br />
work inclu<strong>de</strong>s very consistent co-regulation of genes many times<br />
involved in common pathways.<br />
A high confi<strong>de</strong>nce human coexpression network reveals<br />
a map of ubiquitous biological functions<br />
As far as we know, none of the previously published human<br />
coexpression networks [2,5,6] has a comprehensive calculation of the<br />
estimated statistical error in the datasets at different levels of<br />
gn coexp/gn 2<br />
% gn coexp mean r 3<br />
Proteasome (3050) 31 28/28 100.0% 0.69<br />
Ribosome (3010) 120 52/55 94.5% 0.75<br />
Oxidative phosphorylation (190) 129 88/95 92.6% 0.73<br />
Focal adhesion (4510) 194 154/168 91.7% 0.68<br />
Antigen processing and presentation (4612) 86 71/78 91.0% 0.75<br />
Glycan structures - <strong>de</strong>gradation (1032) 30 20/22 90.9% 0.65<br />
Neuroactive ligand-receptor interact. (4080) 299 227/255 89.0% 0.68<br />
Cell cycle (4110) 114 90/102 88.2% 0.66<br />
Regulation of actin cytoskeleton (4810) 208 141/161 88.2% 0.66<br />
Cytokine-cytokine receptor interact. (4060) 256 196/223 87.9% 0.69<br />
Lee et al. (2004)<br />
Pathway Name (KEGG ID number) nu gn 1<br />
gn coexp/gn 2<br />
% gn coexp<br />
Ribosome (3010) 120 43/44 97.7%<br />
Proteasome (3050) 31 19/22 86.4%<br />
Oxidative phosphorylation (190) 129 31/44 70.5%<br />
Cell cycle (4110) 114 33/47 70.2%<br />
ECM-receptor interaction (4512) 87 16/23 69.6%<br />
Gap junction (4540) 92 9/13 69.2%<br />
Pathogenic Escherichia coli infection (5130) 49 11/16 68.8%<br />
Pathogenic Escherichia coli infection (5131) 49 11/16 68.8%<br />
T cell receptor signaling pathway (4660) 93 15/22 68.2%<br />
Metabolism of xenobiotics by cytP450 (980) 70 7/11 63.6%<br />
Griffith et al. (2005)<br />
Pathway Name (KEGG ID number) nu gn 1<br />
gn coexp/gn 2<br />
% gn coexp<br />
Ribosome (3010) 120 36/38 94.7%<br />
Proteasome (3050) 31 20/24 83.3%<br />
Oxidative phosphorylation (190) 129 55/67 82.1%<br />
Val, Leu and isoleucine <strong>de</strong>gradation (280) 50 15/19 78.9%<br />
ECM-receptor interaction (4512) 87 16/22 72.7%<br />
Cell cycle (4110) 114 36/51 70.6%<br />
Propanoate metabolism (640) 34 9/14 64.3%<br />
Butanoate metabolism (650) 44 9/14 64.3%<br />
Hematopoietic cell lineage (4640) 88 18/28 64.3%<br />
beta-Alanine metabolism (410) 24 7/11 63.6%<br />
1<br />
nu gn = whole number of genes inclu<strong>de</strong>d in this KEGG pathway.<br />
2<br />
gn coexp/gn = genes that coexpress within the genes inclu<strong>de</strong>d for this pathway in the network.<br />
3<br />
mean value of the correlation factor (r) for the coexpressing gene pairs inclu<strong>de</strong>d in this pathway.<br />
doi:10.1371/journal.pone.0003911.t001<br />
Human Gene Coexpression Map<br />
coverage. However, following the analysis and data presented in<br />
Figure 4 we can select coexpression datasets at specific thresholds of<br />
PPV accuracy. In or<strong>de</strong>r to gain in reliability, we can also combine<br />
the data obtained with 2 methods: MAS5-Spearman and RMA-<br />
Pearson. This was done taking the datasets of both methods with<br />
PPV$0.60 (3052 and 1672 genes) to produce an intersect<br />
coexpression network that inclu<strong>de</strong>s 731 genes and 2249 coexpression<br />
interactions (see Fig. 4D). We also restrict the network including<br />
only coexpressing groups including at least three genes. In this way, a<br />
high confi<strong>de</strong>nce core subset of 615 gene no<strong>de</strong>s and 2190<br />
coexpression links was obtained.<br />
PLoS ONE | www.plosone.org 9 December 2008 | Volume 3 | Issue 12 | e3911


