

Alberto Risueño Pérez - Gredos - Universidad de Salamanca
Alberto Risueño Pérez - Gredos - Universidad de Salamanca
Alberto Risueño Pérez - Gredos - Universidad de Salamanca

Create successful ePaper yourself
Turn your PDF publications into a flip-book with our unique Google optimized e-Paper software.
annotations in GO and KEGG, and thereby constructs several<br />
groups of genes of functional significance. The most significant<br />
biological mechanisms, pathways and functional categories in the<br />
data sets of genes selected by statistical analysis were i<strong>de</strong>ntified<br />
through the use of Ingenuity Pathways Analysis Sep2011<br />
(Ingenuity Systems, Mountain View, CA, USA).<br />
Gene-specific semi-quantitative PCR. Semi-quantitative<br />
SYBRgreen PCR was done in triplicate with iQ TM SYBRH<br />
Green Supermix kit (BioRad) using the IQ5 Multicolor Real-Time<br />
PCR Detection System (Bio-Rad). Expression data for selected<br />
genes were validated in a subset of CLL patients (n = 40). Sense<br />
and antisense primers were <strong>de</strong>signed based on the probe-sets used<br />
by Affymetrix to synthesize the GeneChip Primer sequences<br />
(Table S2). The ABL1 gene was used as the internal control and<br />
the quantification of relative expression [reported as arbitrary units<br />
(a.u.)] were performed using the comparative Ct method. The data<br />
were not normally distributed, so non-parametric tests were used.<br />
Expression levels of the selected genes in both groups (13q-H and<br />
13q-L) were analyzed using the Mann-Whitney U test with a twotailed<br />
value of P,0.05 for statistical significance. All tests were<br />
performed using SPSS v19.0.<br />
Quantification of miRNA expression levels. The expression<br />
of selected mature miRNAs was assayed using the Taqman<br />
MicroRNA Assays (Applied Biosystems) specific to hsa-mir-15a,<br />
hsa-mir-29a, hsa-mir-155 and hsa-mir-223 in 24 CLL patients<br />
displaying 13q- according to the manufacturer’s recommendations.<br />
The Taqman MicroRNA Assays for U43 RNA (RNU43,<br />
Applied Biosystems) was used to normalize the relative abundance<br />
of miRNA using the 2 2DCt method. All experiments were<br />
performed in duplicate. Expression levels [reported as arbitrary<br />
units (a.u.)] of the selected miRNAs in both groups (13q-H and<br />
13q-L) were analyzed using the Mann-Whitney U test in SPSS<br />
v19.0. Values of P,0.05 were consi<strong>de</strong>red statistically significant.<br />
Integrative analysis of miRNA and gene expression<br />
profile. A summary of the miRNA analysis performed in the<br />
study is shown in the Figure S1. miRNAs with significantly<br />
different expression (FDR,0.05) between 13q-H and 13q-L were<br />
further analyzed to i<strong>de</strong>ntify the networks and pathway targets. For<br />
this purpose, IPA’s microRNA Target Filter, which enables<br />
prioritization of experimentally validated and predicted mRNA<br />
targets from TargetScan, TarBase, miRecords and the Ingenuity<br />
Knowledge Base was used. This tool i<strong>de</strong>ntified the putative targets<br />
for the input miRNAs and then <strong>de</strong>veloped the networks among the<br />
targets and i<strong>de</strong>ntified the known and most relevant biological<br />
functions, pathways and annotations in this enriched set of target<br />
genes. By applying the expression pairing tool, the analysis was<br />
focused on targets exhibiting altered expression in our analysis,<br />
finding miRNAs and their target genes with opposite or same<br />
expression.<br />
Results<br />
Molecular Characterization of 13q- CLL<br />
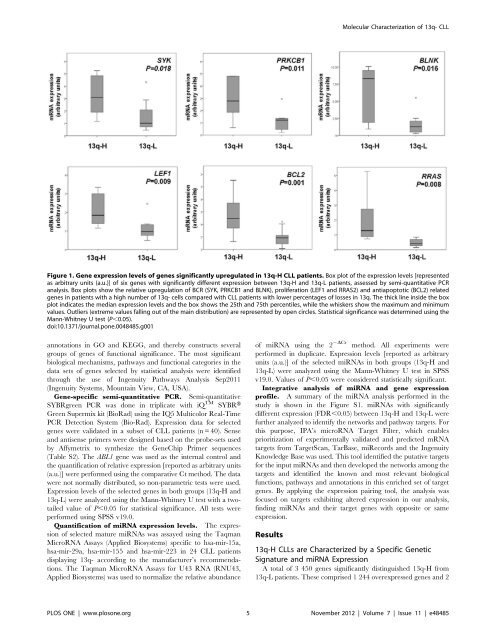
Figure 1. Gene expression levels of genes significantly upregulated in 13q-H CLL patients. Box plot of the expression levels [represented<br />
as arbitrary units (a.u.)] of six genes with significantly different expression between 13q-H and 13q-L patients, assessed by semi-quantitative PCR<br />
analysis. Box plots show the relative upregulation of BCR (SYK, PRKCB1 and BLNK), proliferation (LEF1 and RRAS2) and antiapoptotic (BCL2) related<br />
genes in patients with a high number of 13q- cells compared with CLL patients with lower percentages of losses in 13q. The thick line insi<strong>de</strong> the box<br />
plot indicates the median expression levels and the box shows the 25th and 75th percentiles, while the whiskers show the maximum and minimum<br />
values. Outliers (extreme values falling out of the main distribution) are represented by open circles. Statistical significance was <strong>de</strong>termined using the<br />
Mann-Whitney U test (P,0.05).<br />
doi:10.1371/journal.pone.0048485.g001<br />
13q-H CLLs are Characterized by a Specific Genetic<br />
Signature and miRNA Expression<br />
A total of 3 450 genes significantly distinguished 13q-H from<br />
13q-L patients. These comprised 1 244 overexpressed genes and 2<br />
PLOS ONE | www.plosone.org 5 November 2012 | Volume 7 | Issue 11 | e48485


