

Alberto Risueño Pérez - Gredos - Universidad de Salamanca
Alberto Risueño Pérez - Gredos - Universidad de Salamanca
Alberto Risueño Pérez - Gredos - Universidad de Salamanca

You also want an ePaper? Increase the reach of your titles
YUMPU automatically turns print PDFs into web optimized ePapers that Google loves.
<strong>Risueño</strong> et al. BMC Bioinformatics 2010, 11:221<br />
http://www.biomedcentral.com/1471-2105/11/221<br />
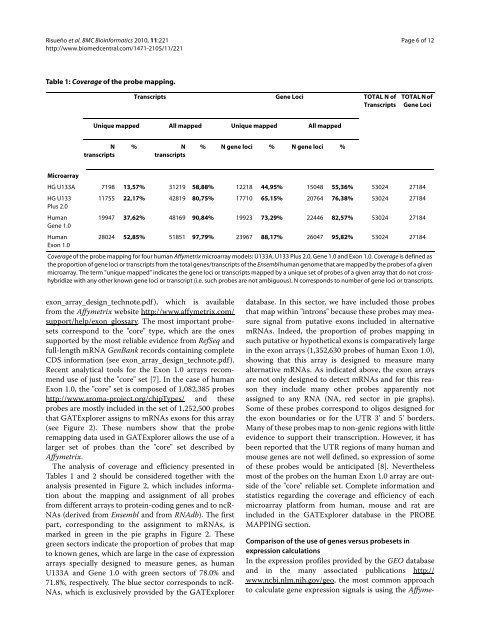
Table 1: Coverage of the probe mapping.<br />
Transcripts Gene Loci TOTAL N of<br />
Transcripts<br />
Unique mapped All mapped Unique mapped All mapped<br />
N<br />
transcripts<br />
% N<br />
transcripts<br />
exon_array_<strong>de</strong>sign_technote.pdf), which is available<br />
from the Affymetrix website http://www.affymetrix.com/<br />
support/help/exon_glossary. The most important probesets<br />
correspond to the "core" type, which are the ones<br />
supported by the most reliable evi<strong>de</strong>nce from RefSeq and<br />
full-length mRNA GenBank records containing complete<br />
CDS information (see exon_array_<strong>de</strong>sign_technote.pdf).<br />
Recent analytical tools for the Exon 1.0 arrays recommend<br />
use of just the "core" set [7]. In the case of human<br />
Exon 1.0, the "core" set is composed of 1,082,385 probes<br />
http://www.aroma-project.org/chipTypes/ and these<br />
probes are mostly inclu<strong>de</strong>d in the set of 1,252,500 probes<br />
that GATExplorer assigns to mRNAs exons for this array<br />
(see Figure 2). These numbers show that the probe<br />
remapping data used in GATExplorer allows the use of a<br />
larger set of probes than the "core" set <strong>de</strong>scribed by<br />
Affymetrix.<br />
The analysis of coverage and efficiency presented in<br />
Tables 1 and 2 should be consi<strong>de</strong>red together with the<br />
analysis presented in Figure 2, which inclu<strong>de</strong>s information<br />
about the mapping and assignment of all probes<br />
from different arrays to protein-coding genes and to ncR-<br />
NAs (<strong>de</strong>rived from Ensembl and from RNAdb). The first<br />
part, corresponding to the assignment to mRNAs, is<br />
marked in green in the pie graphs in Figure 2. These<br />
green sectors indicate the proportion of probes that map<br />
to known genes, which are large in the case of expression<br />
arrays specially <strong>de</strong>signed to measure genes, as human<br />
U133A and Gene 1.0 with green sectors of 78.0% and<br />
71.8%, respectively. The blue sector corresponds to ncR-<br />
NAs, which is exclusively provi<strong>de</strong>d by the GATExplorer<br />
% N gene loci % N gene loci %<br />
Page 6 of 12<br />
TOTAL N of<br />
Gene Loci<br />
Microarray<br />
HG U133A 7198 13,57% 31219 58,88% 12218 44,95% 15048 55,36% 53024 27184<br />
HG U133<br />
Plus 2.0<br />
11755 22,17% 42819 80,75% 17710 65,15% 20764 76,38% 53024 27184<br />
Human<br />
Gene 1.0<br />
19947 37,62% 48169 90,84% 19923 73,29% 22446 82,57% 53024 27184<br />
Human<br />
28024 52,85% 51851 97,79% 23967 88,17% 26047 95,82% 53024 27184<br />
Exon 1.0<br />
Coverage of the probe mapping for four human Affymetrix microarray mo<strong>de</strong>ls: U133A, U133 Plus 2.0, Gene 1.0 and Exon 1.0. Coverage is <strong>de</strong>fined as<br />
the proportion of gene loci or transcripts from the total genes/transcripts of the Ensembl human genome that are mapped by the probes of a given<br />
microarray. The term "unique mapped" indicates the gene loci or transcripts mapped by a unique set of probes of a given array that do not crosshybridize<br />
with any other known gene loci or transcript (i.e. such probes are not ambiguous). N corresponds to number of gene loci or transcripts.<br />
database. In this sector, we have inclu<strong>de</strong>d those probes<br />
that map within "introns" because these probes may measure<br />
signal from putative exons inclu<strong>de</strong>d in alternative<br />
mRNAs. In<strong>de</strong>ed, the proportion of probes mapping in<br />
such putative or hypothetical exons is comparatively large<br />
in the exon arrays (1,352,630 probes of human Exon 1.0),<br />
showing that this array is <strong>de</strong>signed to measure many<br />
alternative mRNAs. As indicated above, the exon arrays<br />
are not only <strong>de</strong>signed to <strong>de</strong>tect mRNAs and for this reason<br />
they inclu<strong>de</strong> many other probes apparently not<br />
assigned to any RNA (NA, red sector in pie graphs).<br />
Some of these probes correspond to oligos <strong>de</strong>signed for<br />
the exon boundaries or for the UTR 3' and 5' bor<strong>de</strong>rs.<br />
Many of these probes map to non-genic regions with little<br />
evi<strong>de</strong>nce to support their transcription. However, it has<br />
been reported that the UTR regions of many human and<br />
mouse genes are not well <strong>de</strong>fined, so expression of some<br />
of these probes would be anticipated [8]. Nevertheless<br />
most of the probes on the human Exon 1.0 array are outsi<strong>de</strong><br />
of the "core" reliable set. Complete information and<br />
statistics regarding the coverage and efficiency of each<br />
microarray platform from human, mouse and rat are<br />
inclu<strong>de</strong>d in the GATExplorer database in the PROBE<br />
MAPPING section.<br />
Comparison of the use of genes versus probesets in<br />
expression calculations<br />
In the expression profiles provi<strong>de</strong>d by the GEO database<br />
and in the many associated publications http://<br />
www.ncbi.nlm.nih.gov/geo, the most common approach<br />
to calculate gene expression signals is using the Affyme-


