

Alberto Risueño Pérez - Gredos - Universidad de Salamanca
Alberto Risueño Pérez - Gredos - Universidad de Salamanca
Alberto Risueño Pérez - Gredos - Universidad de Salamanca

Create successful ePaper yourself
Turn your PDF publications into a flip-book with our unique Google optimized e-Paper software.
Comparison of human coexpression datasets: molecular<br />
machines and pathways consistently co-regulated<br />
In a second approach, we investigate the functional assignment of<br />
the gene coexpression data following the strategy taken by Stuart et al.<br />
[5], who explored functional coverage on a coexpression network<br />
obtained for four organisms looking at the percentage of genes that<br />
are connected to at least one other gene in the same ‘‘functional<br />
category’’. We proceed to the same percentage calculation using the<br />
KEGG pathways as ‘‘functional categories’’. The analysis was done<br />
for the coexpression dataset <strong>de</strong>rived from RMA-Pearson method<br />
with r.0.63 and N.500. The same functional analysis was also<br />
done using two other external human coexpression datasets<br />
previously published by Lee et al. [2] and Griffith et al. [6].<br />
The results are presented in Table 1, that inclu<strong>de</strong>s the ten-top<br />
pathways found with best percentage of genes coexpressing within<br />
the gene groups assigned to KEGG pathways for 3 different human<br />
coexpression datasets (this work, Lee et al. and Griffith et al.). This<br />
comparative analysis of functional coverage shows some interesting<br />
results: (i) All coexpression datasets find the most significant<br />
coexpression for 3 key molecular machines: ribosome, proteasome<br />
and oxidative phosphorylation. (ii) Genes involved in cell scaffolding<br />
and cell to cell interaction or anchoring are also found to coexpress<br />
quite often, as indicated by the presence of pathways like focal<br />
adhesion, extracellular matrix (ECM) interaction and cytoskeleton<br />
regulation. (iii) Genes involved in cell cycle pathway are also<br />
Human Gene Coexpression Map<br />
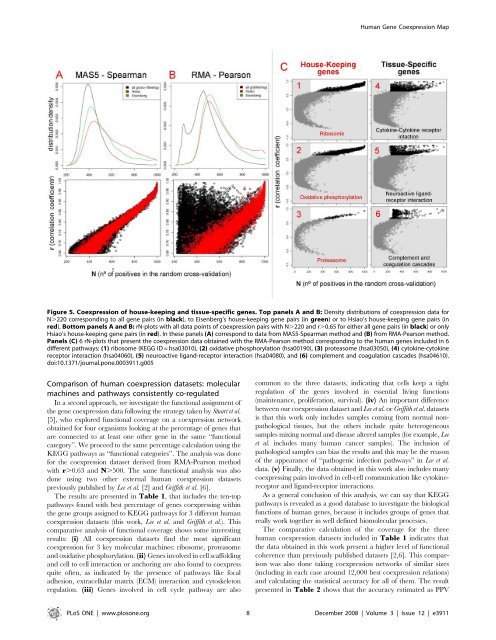
Figure 5. Coexpression of house-keeping and tissue-specific genes. Top panels A and B: Density distributions of coexpression data for<br />
N.220 corresponding to all gene pairs (in black), to Eisenberg’s house-keeping gene pairs (in green) or to Hsiao’s house-keeping gene pairs (in<br />
red). Bottom panels A and B: rN-plots with all data points of coexpression pairs with N.220 and r.0.65 for either all gene pairs (in black) or only<br />
Hsiao’s house-keeping gene pairs (in red). In these panels (A) correspond to data from MAS5-Spearman method and (B) from RMA-Pearson method.<br />
Panels (C) 6 rN-plots that present the coexpression data obtained with the RMA-Pearson method corresponding to the human genes inclu<strong>de</strong>d in 6<br />
different pathways: (1) ribosome (KEGG ID = hsa03010), (2) oxidative phosphorylation (hsa00190), (3) proteasome (hsa03050), (4) cytokine-cytokine<br />
receptor interaction (hsa04060), (5) neuroactive ligand-receptor interaction (hsa04080), and (6) complement and coagulation casca<strong>de</strong>s (hsa04610).<br />
doi:10.1371/journal.pone.0003911.g005<br />
common to the three datasets, indicating that cells keep a tight<br />
regulation of the genes involved in essential living functions<br />
(maintenance, proliferation, survival). (iv) An important difference<br />
between our coexpression dataset and Lee et al. or Griffith et al. datasets<br />
is that this work only inclu<strong>de</strong>s samples coming from normal nonpathological<br />
tissues, but the others inclu<strong>de</strong> quite heterogeneous<br />
samples mixing normal and disease altered samples (for example, Lee<br />
et al. inclu<strong>de</strong>s many human cancer samples). The inclusion of<br />
pathological samples can bias the results and this may be the reason<br />
of the appearance of ‘‘pathogenic infection pathways’’ in Lee et al.<br />
data. (v) Finally, the data obtained in this work also inclu<strong>de</strong>s many<br />
coexpressing pairs involved in cell-cell communication like cytokinereceptor<br />
and ligand-receptor interactions.<br />
As a general conclusion of this analysis, we can say that KEGG<br />
pathways is revealed as a good database to investigate the biological<br />
functions of human genes, because it inclu<strong>de</strong>s groups of genes that<br />
really work together in well <strong>de</strong>fined biomolecular processes.<br />
The comparative calculation of the coverage for the three<br />
human coexpression datasets inclu<strong>de</strong>d in Table 1 indicates that<br />
the data obtained in this work present a higher level of functional<br />
coherence than previously published datasets [2,6]. This comparison<br />
was also done taking coexpression networks of similar sizes<br />
(including in each case around 12,000 best coexpression relations)<br />
and calculating the statistical accuracy for all of them. The result<br />
presented in Table 2 shows that the accuracy estimated as PPV<br />
PLoS ONE | www.plosone.org 8 December 2008 | Volume 3 | Issue 12 | e3911


