

Alberto Risueño Pérez - Gredos - Universidad de Salamanca
Alberto Risueño Pérez - Gredos - Universidad de Salamanca
Alberto Risueño Pérez - Gredos - Universidad de Salamanca

Create successful ePaper yourself
Turn your PDF publications into a flip-book with our unique Google optimized e-Paper software.
<strong>Risueño</strong> et al. BMC Bioinformatics 2010, 11:221<br />
http://www.biomedcentral.com/1471-2105/11/221<br />
presence of a poly-A tail. This type of microarrays can<br />
<strong>de</strong>tect many more ncRNAs.<br />
The results of the remapping of array probes to ncR-<br />
NAs showed that 29.7% of the probes from human Exon<br />
1.0 and 26.5% of the probes from U133 Plus 2.0 map to<br />
Page 9 of 12<br />
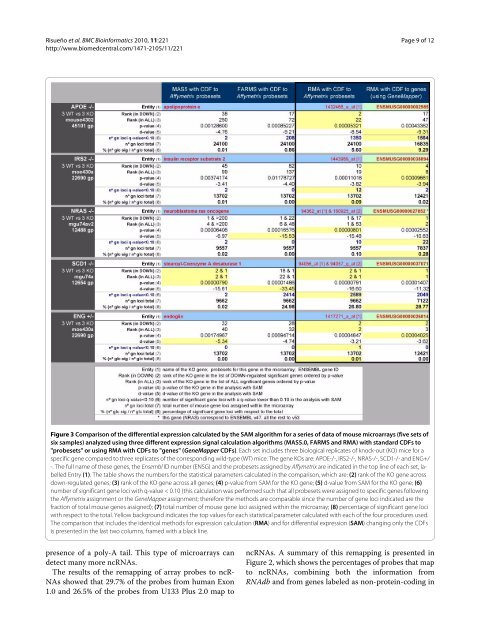
Figure 3 Comparison of the differential expression calculated by the SAM algorithm for a series of data of mouse microarrays (five sets of<br />
six samples) analyzed using three different expression signal calculation algorithms (MAS5.0, FARMS and RMA) with standard CDFs to<br />
"probesets" or using RMA with CDFs to "genes" (GeneMapper CDFs). Each set inclu<strong>de</strong>s three biological replicates of knock-out (KO) mice for a<br />
specific gene compared to three replicates of the corresponding wild-type (WT) mice. The gene KOs are: APOE-/-, IRS2-/-, NRAS-/-, SCD1-/- and ENG+/<br />
-. The full name of these genes, the Ensembl ID number (ENSG) and the probesets assigned by Affymetrix are indicated in the top line of each set, labelled<br />
Entry (1). The table shows the numbers for the statistical parameters calculated in the comparison, which are: (2) rank of the KO gene across<br />
down-regulated genes; (3) rank of the KO gene across all genes; (4) p-value from SAM for the KO gene; (5) d-value from SAM for the KO gene; (6)<br />
number of significant gene loci with q-value < 0.10 (this calculation was performed such that all probesets were assigned to specific genes following<br />
the Affymetrix assignment or the GeneMapper assignment; therefore the methods are comparable since the number of gene loci indicated are the<br />
fraction of total mouse genes assigned); (7) total number of mouse gene loci assigned within the microarray; (8) percentage of significant gene loci<br />
with respect to the total. Yellow background indicates the top values for each statistical parameter calculated with each of the four procedures used.<br />
The comparison that inclu<strong>de</strong>s the i<strong>de</strong>ntical methods for expression calculation (RMA) and for differential expression (SAM) changing only the CDFs<br />
is presented in the last two columns, framed with a black line.<br />
ncRNAs. A summary of this remapping is presented in<br />
Figure 2, which shows the percentages of probes that map<br />
to ncRNAs, combining both the information from<br />
RNAdb and from genes labeled as non-protein-coding in


