

Alberto Risueño Pérez - Gredos - Universidad de Salamanca
Alberto Risueño Pérez - Gredos - Universidad de Salamanca
Alberto Risueño Pérez - Gredos - Universidad de Salamanca

Create successful ePaper yourself
Turn your PDF publications into a flip-book with our unique Google optimized e-Paper software.
all data points of coexpression pairs with N.220 and r.0.65 for<br />
either all gene pairs (in black) or only Hsiao’s house-keeping gene<br />
pairs (in red). Panels A correspond to coexpression data obtained<br />
with method MAS5-Spearman and B to RMA-Pearson. The results<br />
reveal that house-keeping genes have a clear ten<strong>de</strong>ncy to coexpress<br />
in many different tissues. This can be expected from the mere<br />
<strong>de</strong>finition of house-keeping; however, since the result is obtained by<br />
mapping external datasets [16,17] on our human gene coexpression<br />
data, it provi<strong>de</strong>s functional validity to our coexpression study. The<br />
analysis also reveals a clear difference between the data obtained<br />
with different methods. Meanwhile MAS5-Spearman method finds<br />
mainly house-keeping gene coexpression, the RMA-Pearson method<br />
finds many gene pairs that are not in the major house-keeping<br />
region, but rather they show high levels of r correlation with lower<br />
levels of N cross-validation (N.220 and N,600).<br />
We further investigate this observation by selecting subsets of the<br />
coexpression data for genes inclu<strong>de</strong>d in specific KEGG pathways.<br />
Examples of this subsetting are presented in Fig. 5C, that inclu<strong>de</strong>s 6<br />
Human Gene Coexpression Map<br />
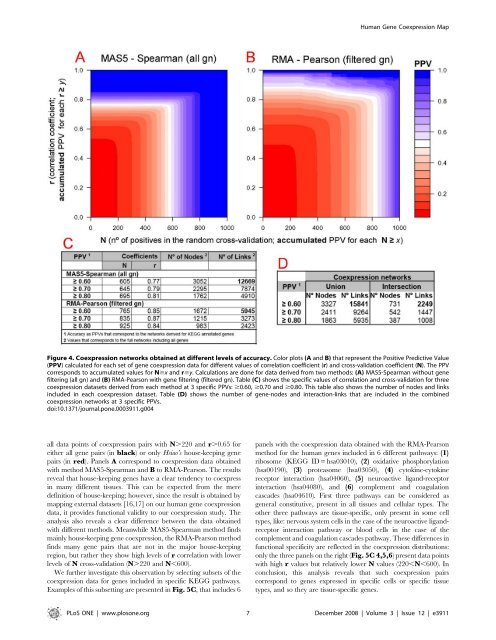
Figure 4. Coexpression networks obtained at different levels of accuracy. Color plots (A and B) that represent the Positive Predictive Value<br />
(PPV) calculated for each set of gene coexpression data for different values of correlation coefficient (r) and cross-validation coefficient (N). The PPV<br />
corresponds to accumulated values for N$x and r$y. Calculations are done for data <strong>de</strong>rived from two methods: (A) MAS5-Spearman without gene<br />
filtering (all gn) and (B) RMA-Pearson with gene filtering (filtered gn). Table (C) shows the specific values of correlation and cross-validation for three<br />
coexpression datasets <strong>de</strong>rived from each method at 3 specific PPVs: $0.60, $0.70 and $0.80. This table also shows the number of no<strong>de</strong>s and links<br />
inclu<strong>de</strong>d in each coexpression dataset. Table (D) shows the number of gene-no<strong>de</strong>s and interaction-links that are inclu<strong>de</strong>d in the combined<br />
coexpression networks at 3 specific PPVs.<br />
doi:10.1371/journal.pone.0003911.g004<br />
panels with the coexpression data obtained with the RMA-Pearson<br />
method for the human genes inclu<strong>de</strong>d in 6 different pathways: (1)<br />
ribosome (KEGG ID = hsa03010), (2) oxidative phosphorylation<br />
(hsa00190), (3) proteasome (hsa03050), (4) cytokine-cytokine<br />
receptor interaction (hsa04060), (5) neuroactive ligand-receptor<br />
interaction (hsa04080), and (6) complement and coagulation<br />
casca<strong>de</strong>s (hsa04610). First three pathways can be consi<strong>de</strong>red as<br />
general constitutive, present in all tissues and cellular types. The<br />
other three pathways are tissue-specific, only present in some cell<br />
types, like: nervous system cells in the case of the neuroactive ligandreceptor<br />
interaction pathway or blood cells in the case of the<br />
complement and coagulation casca<strong>de</strong>s pathway. These differences in<br />
functional specificity are reflected in the coexpression distributions:<br />
only the three panels on the right (Fig. 5C 4,5,6) present data points<br />
with high r values but relatively lower N values (220,N,600). In<br />
conclusion, this analysis reveals that such coexpression pairs<br />
correspond to genes expressed in specific cells or specific tissue<br />
types, and so they are tissue-specific genes.<br />
PLoS ONE | www.plosone.org 7 December 2008 | Volume 3 | Issue 12 | e3911


