

Alberto Risueño Pérez - Gredos - Universidad de Salamanca
Alberto Risueño Pérez - Gredos - Universidad de Salamanca
Alberto Risueño Pérez - Gredos - Universidad de Salamanca

Create successful ePaper yourself
Turn your PDF publications into a flip-book with our unique Google optimized e-Paper software.
differences, we inclu<strong>de</strong>d in this cohort patients with normal FISH<br />
(nCLL) and healthy donors as two different types of controls.<br />
Overall, the expression pattern of B lymphocytes from 13q-H<br />
and 13q-L CLL patients and nCLLs was notably different from<br />
the gene expression profile of B lymphocytes from healthy donors,<br />
as expected (Figure 5). PCA revealed a cumulative variance<br />
between groups of 48.3%, 60.9% and 68.3% corresponding to<br />
one, two and three of the initial components, respectively. Since<br />
the first three principal components explained a consi<strong>de</strong>rable<br />
proportion of the overall variance (68%), the 3D representation<br />
was able to show the main similarities and differences between<br />
categories. Notably, the 13q-H samples were largely separated<br />
from the others. Thus, 13q-H patients had a distinctive GEP that<br />
was different not only from healthy donors but also from all other<br />
CLLs, including 13q-L patients. By contrast, the gene expression<br />
of B lymphocytes from 13q-L CLL and nCLL was similar<br />
(Figure 5). SAM analysis revealed differences in the expression of<br />
15 332 and 16 754 genes between CD19+cells from 13q-L or<br />
nCLL compared with B lymphocytes from healthy donors,<br />
respectively, while both subgroups (13q-L and nCLL patients)<br />
shared the <strong>de</strong>regulation of 13 749 genes (data not shown).<br />
Molecular Characterization of 13q- CLL<br />
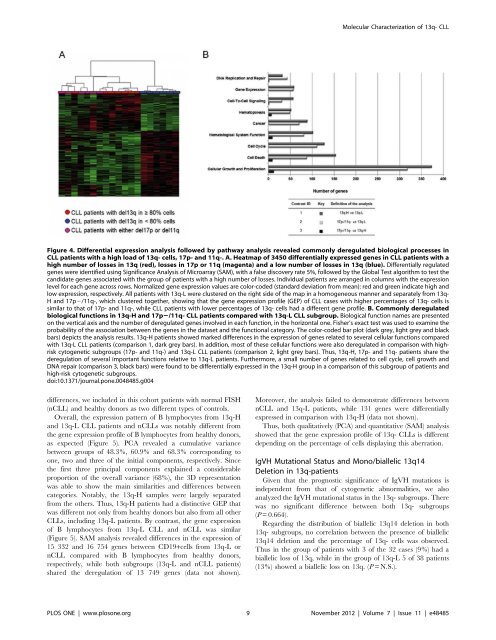
Figure 4. Differential expression analysis followed by pathway analysis revealed commonly <strong>de</strong>regulated biological processes in<br />
CLL patients with a high load of 13q- cells, 17p- and 11q-. A. Heatmap of 3450 differentially expressed genes in CLL patients with a<br />
high number of losses in 13q (red), losses in 17p or 11q (magenta) and a low number of losses in 13q (blue). Differentially regulated<br />
genes were i<strong>de</strong>ntified using Significance Analysis of Microarray (SAM), with a false discovery rate 5%, followed by the Global Test algorithm to test the<br />
candidate genes associated with the group of patients with a high number of losses. Individual patients are arranged in columns with the expression<br />
level for each gene across rows. Normalized gene expression values are color-co<strong>de</strong>d (standard <strong>de</strong>viation from mean): red and green indicate high and<br />
low expression, respectively. All patients with 13q-L were clustered on the right si<strong>de</strong> of the map in a homogeneous manner and separately from 13q-<br />
H and 17p2/11q-, which clustered together, showing that the gene expression profile (GEP) of CLL cases with higher percentages of 13q- cells is<br />
similar to that of 17p- and 11q-, while CLL patients with lower percentages of 13q- cells had a different gene profile. B. Commonly <strong>de</strong>regulated<br />
biological functions in 13q-H and 17p2/11q- CLL patients compared with 13q-L CLL subgroup. Biological function names are presented<br />
on the vertical axis and the number of <strong>de</strong>regulated genes involved in each function, in the horizontal one. Fisher’s exact test was used to examine the<br />
probability of the association between the genes in the dataset and the functional category. The color-co<strong>de</strong>d bar plot (dark grey, light grey and black<br />
bars) <strong>de</strong>picts the analysis results. 13q-H patients showed marked differences in the expression of genes related to several cellular functions compared<br />
with 13q-L CLL patients (comparison 1, dark grey bars). In addition, most of these cellular functions were also <strong>de</strong>regulated in comparison with highrisk<br />
cytogenetic subgroups (17p- and 11q-) and 13q-L CLL patients (comparison 2, light grey bars). Thus, 13q-H, 17p- and 11q- patients share the<br />
<strong>de</strong>regulation of several important functions relative to 13q-L patients. Furthermore, a small number of genes related to cell cycle, cell growth and<br />
DNA repair (comparison 3, black bars) were found to be differentially expressed in the 13q-H group in a comparison of this subgroup of patients and<br />
high-risk cytogenetic subgroups.<br />
doi:10.1371/journal.pone.0048485.g004<br />
Moreover, the analysis failed to <strong>de</strong>monstrate differences between<br />
nCLL and 13q-L patients, while 131 genes were differentially<br />
expressed in comparison with 13q-H (data not shown).<br />
Thus, both qualitatively (PCA) and quantitative (SAM) analysis<br />
showed that the gene expression profile of 13q- CLLs is different<br />
<strong>de</strong>pending on the percentage of cells displaying this aberration.<br />
IgVH Mutational Status and Mono/biallelic 13q14<br />
Deletion in 13q-patients<br />
Given that the prognostic significance of IgVH mutations is<br />
in<strong>de</strong>pen<strong>de</strong>nt from that of cytogenetic abnormalities, we also<br />
analyzed the IgVH mutational status in the 13q- subgroups. There<br />
was no significant difference between both 13q- subgroups<br />
(P = 0.664).<br />
Regarding the distribution of biallelic 13q14 <strong>de</strong>letion in both<br />
13q- subgroups, no correlation between the presence of biallelic<br />
13q14 <strong>de</strong>letion and the percentage of 13q- cells was observed.<br />
Thus in the group of patients with 3 of the 32 cases (9%) had a<br />
biallelic loss of 13q, while in the group of 13q-L 5 of 38 patients<br />
(13%) showed a biallelic loss on 13q. (P=N.S.).<br />
PLOS ONE | www.plosone.org 9 November 2012 | Volume 7 | Issue 11 | e48485


