

View/Open - Scholarly Commons Home
View/Open - Scholarly Commons Home
View/Open - Scholarly Commons Home

Create successful ePaper yourself
Turn your PDF publications into a flip-book with our unique Google optimized e-Paper software.
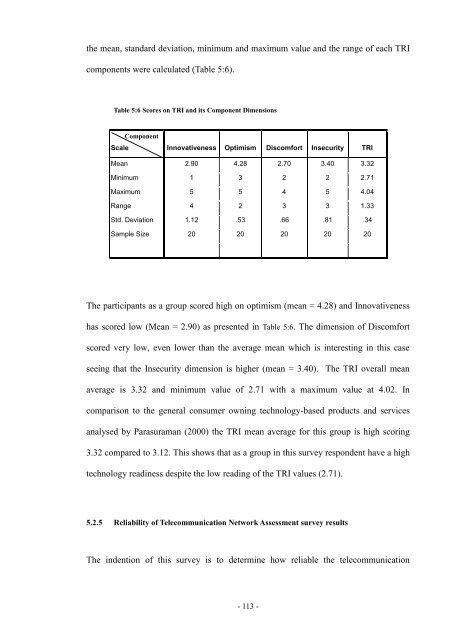
the mean, standard deviation, minimum and maximum value and the range of each TRI<br />
components were calculated (Table 5:6).<br />
Table 5:6 Scores on TRI and its Component Dimensions<br />
Component<br />
Scale Innovativeness Optimism Discomfort Insecurity TRI<br />
Mean 2.90 4.28 2.70 3.40 3.32<br />
Minimum 1 3 2 2 2.71<br />
Maximum 5 5 4 5 4.04<br />
Range 4 2 3 3 1.33<br />
Std. Deviation 1.12 .53 .66 .81 .34<br />
Sample Size 20 20 20 20 20<br />
The participants as a group scored high on optimism (mean = 4.28) and Innovativeness<br />
has scored low (Mean = 2.90) as presented in Table 5:6. The dimension of Discomfort<br />
scored very low, even lower than the average mean which is interesting in this case<br />
seeing that the Insecurity dimension is higher (mean = 3.40). The TRI overall mean<br />
average is 3.32 and minimum value of 2.71 with a maximum value at 4.02. In<br />
comparison to the general consumer owning technology-based products and services<br />
analysed by Parasuraman (2000) the TRI mean average for this group is high scoring<br />
3.32 compared to 3.12. This shows that as a group in this survey respondent have a high<br />
technology readiness despite the low reading of the TRI values (2.71).<br />
5.2.5 Reliability of Telecommunication Network Assessment survey results<br />
The indention of this survey is to determine how reliable the telecommunication<br />
- 113 -


