

View/Open - Scholarly Commons Home
View/Open - Scholarly Commons Home
View/Open - Scholarly Commons Home

Create successful ePaper yourself
Turn your PDF publications into a flip-book with our unique Google optimized e-Paper software.
network is. Respondents were asked to provide their own views base of the<br />
telecommunication network related areas as outline in T5 (Q1-Q7) in Appendix A. All<br />
of the 20 participants attempted all the questions. Similar approach taken in computing<br />
the results of TRI survey questions was used to derive the mean, variance, minimum,<br />
maximum and range of the RTN from the respondents answer (Appendix H).<br />
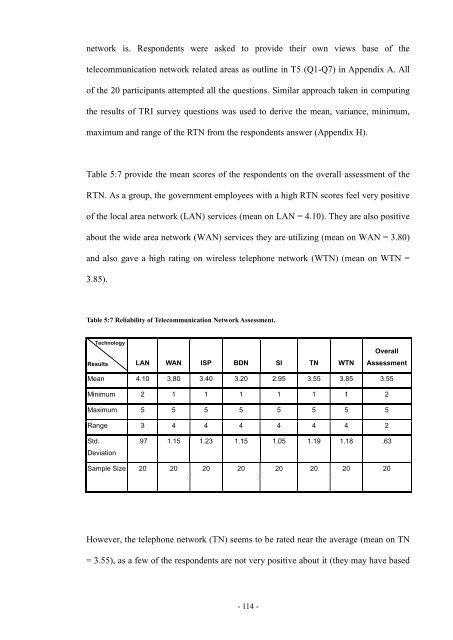
Table 5:7 provide the mean scores of the respondents on the overall assessment of the<br />
RTN. As a group, the government employees with a high RTN scores feel very positive<br />
of the local area network (LAN) services (mean on LAN = 4.10). They are also positive<br />
about the wide area network (WAN) services they are utilizing (mean on WAN = 3.80)<br />
and also gave a high rating on wireless telephone network (WTN) (mean on WTN =<br />
3.85).<br />
Table 5:7 Reliability of Telecommunication Network Assessment.<br />
Technology<br />
Results LAN WAN ISP BDN SI TN WTN<br />
However, the telephone network (TN) seems to be rated near the average (mean on TN<br />
= 3.55), as a few of the respondents are not very positive about it (they may have based<br />
- 114 -<br />
Overall<br />
Assessment<br />
Mean 4.10 3.80 3.40 3.20 2.95 3.55 3.85 3.55<br />
Minimum 2 1 1 1 1 1 1 2<br />
Maximum 5 5 5 5 5 5 5 5<br />
Range 3 4 4 4 4 4 4 2<br />
Std.<br />
Deviation<br />
.97 1.15 1.23 1.15 1.05 1.19 1.18 .63<br />
Sample Size 20 20 20 20 20 20 20 20


