

Handbook of Propagation Effects for Vehicular and ... - Courses
Handbook of Propagation Effects for Vehicular and ... - Courses
Handbook of Propagation Effects for Vehicular and ... - Courses

You also want an ePaper? Increase the reach of your titles
YUMPU automatically turns print PDFs into web optimized ePapers that Google loves.
Earth-Satellite <strong>Propagation</strong> <strong>Effects</strong> Inside Buildings 8-3<br />
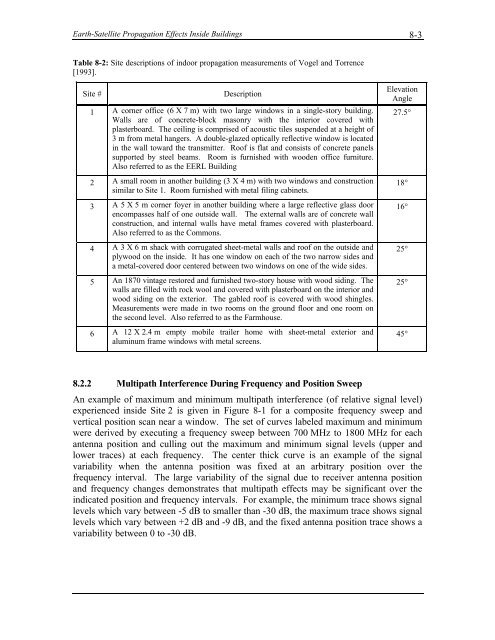
Table 8-2: Site descriptions <strong>of</strong> indoor propagation measurements <strong>of</strong> Vogel <strong>and</strong> Torrence<br />
[1993].<br />
Site # Description<br />
1<br />
2<br />
3<br />
4<br />
5<br />
6<br />
A corner <strong>of</strong>fice (6 X 7 m) with two large windows in a single-story building.<br />
Walls are <strong>of</strong> concrete-block masonry with the interior covered with<br />
plasterboard. The ceiling is comprised <strong>of</strong> acoustic tiles suspended at a height <strong>of</strong><br />
3 m from metal hangers. A double-glazed optically reflective window is located<br />
in the wall toward the transmitter. Ro<strong>of</strong> is flat <strong>and</strong> consists <strong>of</strong> concrete panels<br />
supported by steel beams. Room is furnished with wooden <strong>of</strong>fice furniture.<br />
Also referred to as the EERL Building<br />
A small room in another building (3 X 4 m) with two windows <strong>and</strong> construction<br />
similar to Site 1. Room furnished with metal filing cabinets.<br />
A 5 X 5 m corner foyer in another building where a large reflective glass door<br />
encompasses half <strong>of</strong> one outside wall. The external walls are <strong>of</strong> concrete wall<br />
construction, <strong>and</strong> internal walls have metal frames covered with plasterboard.<br />
Also referred to as the Commons.<br />
A 3 X 6 m shack with corrugated sheet-metal walls <strong>and</strong> ro<strong>of</strong> on the outside <strong>and</strong><br />
plywood on the inside. It has one window on each <strong>of</strong> the two narrow sides <strong>and</strong><br />
a metal-covered door centered between two windows on one <strong>of</strong> the wide sides.<br />
An 1870 vintage restored <strong>and</strong> furnished two-story house with wood siding. The<br />
walls are filled with rock wool <strong>and</strong> covered with plasterboard on the interior <strong>and</strong><br />
wood siding on the exterior. The gabled ro<strong>of</strong> is covered with wood shingles.<br />
Measurements were made in two rooms on the ground floor <strong>and</strong> one room on<br />
the second level. Also referred to as the Farmhouse.<br />
A 12 X 2.4 m empty mobile trailer home with sheet-metal exterior <strong>and</strong><br />
aluminum frame windows with metal screens.<br />
8.2.2 Multipath Interference During Frequency <strong>and</strong> Position Sweep<br />
Elevation<br />
Angle<br />
27.5°<br />
An example <strong>of</strong> maximum <strong>and</strong> minimum multipath interference (<strong>of</strong> relative signal level)<br />
experienced inside Site 2 is given in Figure 8-1 <strong>for</strong> a composite frequency sweep <strong>and</strong><br />
vertical position scan near a window. The set <strong>of</strong> curves labeled maximum <strong>and</strong> minimum<br />
were derived by executing a frequency sweep between 700 MHz to 1800 MHz <strong>for</strong> each<br />
antenna position <strong>and</strong> culling out the maximum <strong>and</strong> minimum signal levels (upper <strong>and</strong><br />
lower traces) at each frequency. The center thick curve is an example <strong>of</strong> the signal<br />
variability when the antenna position was fixed at an arbitrary position over the<br />
frequency interval. The large variability <strong>of</strong> the signal due to receiver antenna position<br />
<strong>and</strong> frequency changes demonstrates that multipath effects may be significant over the<br />
indicated position <strong>and</strong> frequency intervals. For example, the minimum trace shows signal<br />
levels which vary between -5 dB to smaller than -30 dB, the maximum trace shows signal<br />
levels which vary between +2 dB <strong>and</strong> -9 dB, <strong>and</strong> the fixed antenna position trace shows a<br />
variability between 0 to -30 dB.<br />
18°<br />
16°<br />
25°<br />
25°<br />
45°


