

Handbook of Propagation Effects for Vehicular and ... - Courses
Handbook of Propagation Effects for Vehicular and ... - Courses
Handbook of Propagation Effects for Vehicular and ... - Courses

Create successful ePaper yourself
Turn your PDF publications into a flip-book with our unique Google optimized e-Paper software.
8-22<br />
<strong>Propagation</strong> <strong>Effects</strong> <strong>for</strong> <strong>Vehicular</strong> <strong>and</strong> Personal Mobile Satellite Systems<br />
over the frequency range 700 MHz to 1800 MHz (described in Section 8.2). In the ef<strong>for</strong>t<br />
described here, Vogel <strong>and</strong> Torrence used a similar experimental configuration employing<br />
an antenna mounted on a tower which simulated transmissions from a satellite plat<strong>for</strong>m<br />
<strong>and</strong> which radiated right h<strong>and</strong> circular polarization signals (RHCP). The receiving<br />
antenna received RHCP over a beamwidth <strong>of</strong> 90° in both the vertical <strong>and</strong> horizontal<br />
principal planes. As in the previous experiment, the receiving antenna inside each <strong>of</strong> the<br />
buildings was located on a positioner that moved it in 5 cm increments over 16 spatial<br />
positions (80 cm).<br />
8.4.1 Experimental Description<br />
The major components <strong>of</strong> the experiment <strong>of</strong> Vogel <strong>and</strong> Torrence were a 20 m crank-up<br />
transmitter tower mounted on a van, a vector network analyzer (VNA), a personal<br />
computer (PC), <strong>and</strong> a linear positioner. One <strong>of</strong> the two wideb<strong>and</strong> antennas was mounted<br />
atop the tower outside a building <strong>and</strong> the other at the positioner inside where the relative<br />
signal levels (in dB) were determined. As previously described, the relative signal levels<br />
were determined by comparing the levels measured interior to each <strong>of</strong> the buildings with<br />
the reference levels measured <strong>for</strong> the unobstructed line-<strong>of</strong>-sight case outside. The PC<br />
controlled the VNA <strong>and</strong> linear positioner, <strong>and</strong> stored the data from the VNA. The<br />
relative signal frequency was swept between 500 MHz to 3000 MHz at 1 MHz<br />
increments <strong>and</strong> the data were analyzed at a step b<strong>and</strong>width <strong>of</strong> 0.2% <strong>of</strong> the frequency. At<br />
the low frequency end, the sampling increment was there<strong>for</strong>e 1 MHz (500 MHz x 0.002)<br />
<strong>and</strong> at the high end it was 6 MHz (3000 MHz x 0.002). Measurements were made into<br />
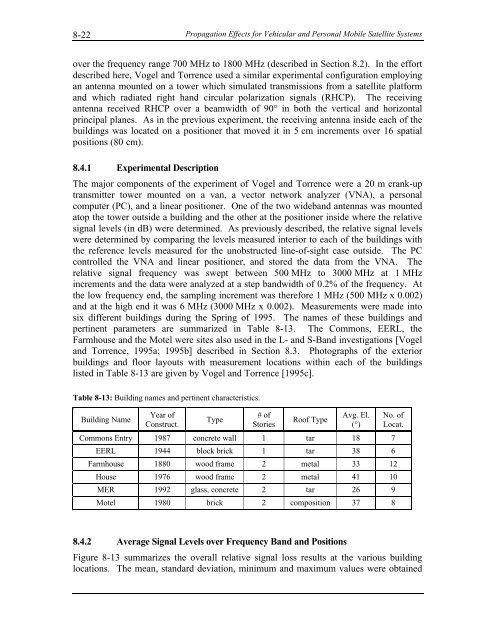
six different buildings during the Spring <strong>of</strong> 1995. The names <strong>of</strong> these buildings <strong>and</strong><br />
pertinent parameters are summarized in Table 8-13. The Commons, EERL, the<br />
Farmhouse <strong>and</strong> the Motel were sites also used in the L- <strong>and</strong> S-B<strong>and</strong> investigations [Vogel<br />
<strong>and</strong> Torrence, 1995a; 1995b] described in Section 8.3. Photographs <strong>of</strong> the exterior<br />
buildings <strong>and</strong> floor layouts with measurement locations within each <strong>of</strong> the buildings<br />
listed in Table 8-13 are given by Vogel <strong>and</strong> Torrence [1995c].<br />
Table 8-13: Building names <strong>and</strong> pertinent characteristics.<br />
Building Name<br />
Year <strong>of</strong><br />
Construct.<br />
Type<br />
# <strong>of</strong><br />
Stories<br />
Ro<strong>of</strong> Type<br />
Avg. El.<br />
(°)<br />
Commons Entry 1987 concrete wall 1 tar 18 7<br />
EERL 1944 block brick 1 tar 38 6<br />
No. <strong>of</strong><br />
Locat.<br />
Farmhouse 1880 wood frame 2 metal 33 12<br />
House 1976 wood frame 2 metal 41 10<br />
MER 1992 glass, concrete 2 tar 26 9<br />
Motel 1980 brick 2 composition 37 8<br />
8.4.2 Average Signal Levels over Frequency B<strong>and</strong> <strong>and</strong> Positions<br />
Figure 8-13 summarizes the overall relative signal loss results at the various building<br />
locations. The mean, st<strong>and</strong>ard deviation, minimum <strong>and</strong> maximum values were obtained


