Reading Working Papers in Linguistics 4 (2000) - The University of ...
Reading Working Papers in Linguistics 4 (2000) - The University of ...
Reading Working Papers in Linguistics 4 (2000) - The University of ...

Create successful ePaper yourself
Turn your PDF publications into a flip-book with our unique Google optimized e-Paper software.
S. KULKARNI<br />
4. Quantitative Analyses <strong>of</strong> Three L<strong>in</strong>guistic Variables<br />
4.1 <strong>The</strong> variable (N)<br />
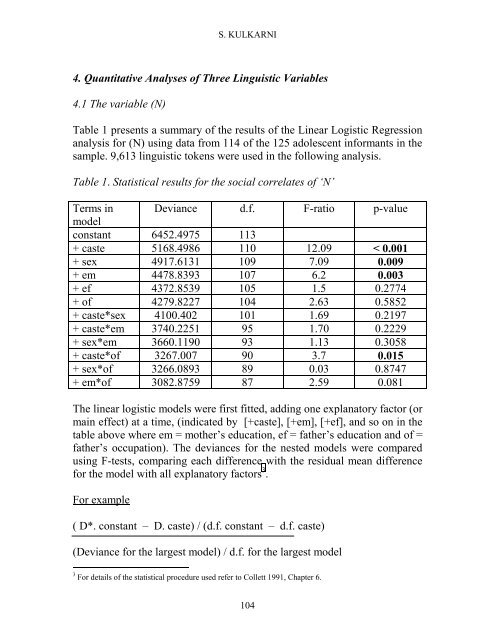
Table 1 presents a summary <strong>of</strong> the results <strong>of</strong> the L<strong>in</strong>ear Logistic Regression<br />
analysis for (N) us<strong>in</strong>g data from 114 <strong>of</strong> the 125 adolescent <strong>in</strong>formants <strong>in</strong> the<br />
sample. 9,613 l<strong>in</strong>guistic tokens were used <strong>in</strong> the follow<strong>in</strong>g analysis.<br />
Table 1. Statistical results for the social correlates <strong>of</strong> ‘N’<br />
Terms <strong>in</strong> Deviance d.f. F-ratio p-value<br />
model<br />
constant 6452.4975 113<br />
+ caste 5168.4986 110 12.09 < 0.001<br />
+ sex 4917.6131 109 7.09 0.009<br />
+ em 4478.8393 107 6.2 0.003<br />
+ ef 4372.8539 105 1.5 0.2774<br />
+ <strong>of</strong> 4279.8227 104 2.63 0.5852<br />
+ caste*sex 4100.402 101 1.69 0.2197<br />
+ caste*em 3740.2251 95 1.70 0.2229<br />
+ sex*em 3660.1190 93 1.13 0.3058<br />
+ caste*<strong>of</strong> 3267.007 90 3.7 0.015<br />
+ sex*<strong>of</strong> 3266.0893 89 0.03 0.8747<br />
+ em*<strong>of</strong> 3082.8759 87 2.59 0.081<br />
<strong>The</strong> l<strong>in</strong>ear logistic models were first fitted, add<strong>in</strong>g one explanatory factor (or<br />
ma<strong>in</strong> effect) at a time, (<strong>in</strong>dicated by [+caste], [+em], [+ef], and so on <strong>in</strong> the<br />
table above where em = mother’s education, ef = father’s education and <strong>of</strong> =<br />
father’s occupation). <strong>The</strong> deviances for the nested models were compared<br />
us<strong>in</strong>g F-tests, compar<strong>in</strong>g each difference with the residual mean difference<br />
for the model with all explanatory factors 3 .<br />
For example<br />
( D*. constant – D. caste) / (d.f. constant – d.f. caste)<br />
(Deviance for the largest model) / d.f. for the largest model<br />
3 For details <strong>of</strong> the statistical procedure used refer to Collett 1991, Chapter 6.<br />
104