- Page 1:
Copyright © Pinsent Masons 2005 Pu
- Page 4 and 5:
£2bn was achieved by increased eff
- Page 6 and 7:
Dr David Lloyd Owen iv DR DAVID OWE
- Page 8 and 9:
PINSENT MASONS WATER SECTOR GROUP F
- Page 10 and 11:
viii CONTENTS DENMARK..............
- Page 12 and 13:
x CONTENTS FRANCE BOUYGUES ........
- Page 14 and 15:
Introduction A new direction for th
- Page 16 and 17:
…while the real cost of conflict
- Page 18 and 19:
How to use this book xv HOW TO USE
- Page 20 and 21:
Russian Utility Systems (Russia) Re
- Page 23 and 24:
Whither Africa? 2 PART 1: 2005-2006
- Page 25 and 26:
Framework for Action Annual Investm
- Page 27 and 28:
6 PART 1: 2005-2006 OVERVIEW most b
- Page 29 and 30:
PART 1: 2005-2006 OVERVIEW and find
- Page 31 and 32:
Responding to these challenges 10 P
- Page 33 and 34:
Identified private sector projects,
- Page 35 and 36:
Three new companies noted 14 PART 1
- Page 37 and 38:
Indicative estimates of the size of
- Page 39 and 40:
Desalination 18 PART 1: 2005-2006 O
- Page 41 and 42:
PART 1: 2005-2006 OVERVIEW apprecia
- Page 43 and 44:
22 PART 1: 2005-2006 OVERVIEW Water
- Page 45 and 46:
[2] Casablanca - block tariffs and
- Page 47 and 48:
[4] Argentina: Serving the Salta Pr
- Page 49 and 50:
[6] Connecting a squatter settlemen
- Page 51 and 52:
Companies Active In, Entering and L
- Page 53 and 54:
Number of People Served by Country
- Page 55 and 56:
How Many People are Served by the P
- Page 57 and 58:
PART 1: 2005-2006 OVERVIEW Company
- Page 59 and 60:
PART 1: 2005-2006 OVERVIEW privatis
- Page 61 and 62:
Country Market Development, Prospec
- Page 63 and 64:
42 PART 1: 2005-2006 OVERVIEW The A
- Page 65 and 66:
National and International Players
- Page 67 and 68:
PART 1: 2005-2006 OVERVIEW Company
- Page 69:
48 PART 1: 2005-2006 OVERVIEW Compa
- Page 73 and 74:
ALBANIA PART 2: COUNTRY ANALYSIS Al
- Page 75 and 76:
ALGERIA PART 2: COUNTRY ANALYSIS Al
- Page 77 and 78:
ARMENIA PART 2: COUNTRY ANALYSIS Ar
- Page 79 and 80:
AUSTRIA PART 2: COUNTRY ANALYSIS Th
- Page 81 and 82:
AZERBAIJAN PART 2: COUNTRY ANALYSIS
- Page 83 and 84:
BELGIUM PART 2: COUNTRY ANALYSIS Be
- Page 85 and 86:
BELGIUM PART 2: COUNTRY ANALYSIS Fo
- Page 87 and 88:
BULGARIA PART 2: COUNTRY ANALYSIS t
- Page 89 and 90:
BURKINA FASO PART 2: COUNTRY ANALYS
- Page 91 and 92:
CAMEROON PART 2: COUNTRY ANALYSIS M
- Page 93 and 94:
CHAD PART 2: COUNTRY ANALYSIS Chad
- Page 95 and 96:
REPUBLIC OF CONGO PART 2: COUNTRY A
- Page 97 and 98:
COTE D'IVOIRE PART 2: COUNTRY ANALY
- Page 99 and 100:
CROATIA PART 2: COUNTRY ANALYSIS Ur
- Page 101 and 102:
CZECH REPUBLIC PART 2: COUNTRY ANAL
- Page 103 and 104:
CZECH REPUBLIC PART 2: COUNTRY ANAL
- Page 105 and 106:
EGYPT PART 2: COUNTRY ANALYSIS Egyp
- Page 107 and 108:
EGYPT PART 2: COUNTRY ANALYSIS Fres
- Page 109 and 110:
ESTONIA PART 2: COUNTRY ANALYSIS Es
- Page 111 and 112:
ETHIOPIA PART 2: COUNTRY ANALYSIS E
- Page 113 and 114:
FRANCE PART 2: COUNTRY ANALYSIS Fra
- Page 115 and 116:
FRANCE PART 2: COUNTRY ANALYSIS Sin
- Page 117 and 118:
GABON PART 2: COUNTRY ANALYSIS Gabo
- Page 119 and 120: GERMANY PART 2: COUNTRY ANALYSIS Ge
- Page 121 and 122: GERMANY PART 2: COUNTRY ANALYSIS In
- Page 123 and 124: GERMANY PART 2: COUNTRY ANALYSIS Pr
- Page 125 and 126: GREECE PART 2: COUNTRY ANALYSIS Gre
- Page 127 and 128: GREECE PART 2: COUNTRY ANALYSIS Flo
- Page 129 and 130: GUINEA PART 2: COUNTRY ANALYSIS Fre
- Page 131 and 132: HUNGARY PART 2: COUNTRY ANALYSIS Hu
- Page 133 and 134: HUNGARY PART 2: COUNTRY ANALYSIS Pr
- Page 135 and 136: IRAQ PART 2: COUNTRY ANALYSIS Iraq
- Page 137 and 138: IRELAND PART 2: COUNTRY ANALYSIS Ir
- Page 139 and 140: IRELAND PART 2: COUNTRY ANALYSIS Gr
- Page 141 and 142: ISRAEL - PALESTINE PART 2: COUNTRY
- Page 143 and 144: ISRAEL - PALESTINE PART 2: COUNTRY
- Page 145 and 146: ITALY PART 2: COUNTRY ANALYSIS and
- Page 147 and 148: ITALY PART 2: COUNTRY ANALYSIS Priv
- Page 149 and 150: JORDAN PART 2: COUNTRY ANALYSIS Jor
- Page 151 and 152: KENYA PART 2: COUNTRY ANALYSIS Keny
- Page 153 and 154: KENYA PART 2: COUNTRY ANALYSIS Oper
- Page 155 and 156: KUWAIT PART 2: COUNTRY ANALYSIS MAJ
- Page 157 and 158: LEBANON PART 2: COUNTRY ANALYSIS Le
- Page 159 and 160: LESOTHO PART 2: COUNTRY ANALYSIS wa
- Page 161 and 162: LITHUANIA PART 2: COUNTRY ANALYSIS
- Page 163 and 164: MALI PART 2: COUNTRY ANALYSIS Mali
- Page 165 and 166: MOROCCO PART 2: COUNTRY ANALYSIS Fr
- Page 167 and 168: MOZAMBIQUE PART 2: COUNTRY ANALYSIS
- Page 169: MOZAMBIQUE PART 2: COUNTRY ANALYSIS
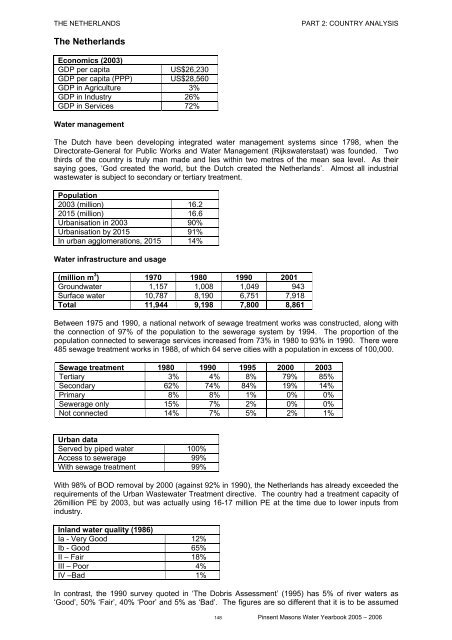
- Page 173 and 174: THE NETHERLANDS PART 2: COUNTRY ANA
- Page 175 and 176: NIGERIA PART 2: COUNTRY ANALYSIS Ni
- Page 177 and 178: NIGERIA PART 2: COUNTRY ANALYSIS (L
- Page 179 and 180: NORWAY PART 2: COUNTRY ANALYSIS spa
- Page 181 and 182: POLAND PART 2: COUNTRY ANALYSIS Pol
- Page 183 and 184: POLAND PART 2: COUNTRY ANALYSIS Pri
- Page 185 and 186: PORTUGAL PART 2: COUNTRY ANALYSIS P
- Page 187 and 188: PORTUGAL PART 2: COUNTRY ANALYSIS G
- Page 189 and 190: ROMANIA PART 2: COUNTRY ANALYSIS Ro
- Page 191 and 192: ROMANIA PART 2: COUNTRY ANALYSIS Pr
- Page 193 and 194: THE RUSSIAN FEDERATION PART 2: COUN
- Page 195 and 196: THE RUSSIAN FEDERATION PART 2: COUN
- Page 197 and 198: SAUDI ARABIA PART 2: COUNTRY ANALYS
- Page 199 and 200: SENEGAL PART 2: COUNTRY ANALYSIS Se
- Page 201 and 202: SLOVAKIA PART 2: COUNTRY ANALYSIS S
- Page 203 and 204: SLOVENIA PART 2: COUNTRY ANALYSIS S
- Page 205 and 206: SOUTH AFRICA PART 2: COUNTRY ANALYS
- Page 207 and 208: SOUTH AFRICA PART 2: COUNTRY ANALYS
- Page 209 and 210: SPAIN PART 2: COUNTRY ANALYSIS Spai
- Page 211 and 212: SPAIN PART 2: COUNTRY ANALYSIS Fres
- Page 213 and 214: SWEDEN PART 2: COUNTRY ANALYSIS Swe
- Page 215 and 216: SWITZERLAND PART 2: COUNTRY ANALYSI
- Page 217 and 218: TANZANIA PART 2: COUNTRY ANALYSIS R
- Page 219 and 220: TUNISIA PART 2: COUNTRY ANALYSIS Pr
- Page 221 and 222:
TURKEY PART 2: COUNTRY ANALYSIS Izm
- Page 223 and 224:
UGANDA PART 2: COUNTRY ANALYSIS Ref
- Page 225 and 226:
UKRAINE PART 2: COUNTRY ANALYSIS Uk
- Page 227 and 228:
UNITED ARAB EMIRATES PART 2: COUNTR
- Page 229 and 230:
UNITED KINGDOM PART 2: COUNTRY ANAL
- Page 231 and 232:
UNITED KINGDOM PART 2: COUNTRY ANAL
- Page 233 and 234:
UNITED KINGDOM PART 2: COUNTRY ANAL
- Page 235:
ZAMBIA PART 2: COUNTRY ANALYSIS Zam
- Page 239 and 240:
FRANCE PART 3 (i): COMPANY ANALYSIS
- Page 241 and 242:
FRANCE PART 3 (i): COMPANY ANALYSIS
- Page 243 and 244:
FRANCE PART 3 (i): COMPANY ANALYSIS
- Page 245 and 246:
FRANCE PART 3 (i): COMPANY ANALYSIS
- Page 247 and 248:
FRANCE PART 3 (i): COMPANY ANALYSIS
- Page 249 and 250:
FRANCE PART 3 (i): COMPANY ANALYSIS
- Page 251 and 252:
FRANCE PART 3 (i): COMPANY ANALYSIS
- Page 253 and 254:
FRANCE PART 3 (i): COMPANY ANALYSIS
- Page 255 and 256:
FRANCE PART 3 (i): COMPANY ANALYSIS
- Page 257 and 258:
FRANCE PART 3 (i): COMPANY ANALYSIS
- Page 259 and 260:
FRANCE PART 3 (i): COMPANY ANALYSIS
- Page 261 and 262:
FRANCE PART 3 (i): COMPANY ANALYSIS
- Page 263 and 264:
FRANCE PART 3 (i): COMPANY ANALYSIS
- Page 265 and 266:
FRANCE PART 3 (i): COMPANY ANALYSIS
- Page 267 and 268:
FRANCE PART 3 (i): COMPANY ANALYSIS
- Page 269 and 270:
FRANCE PART 3 (i): COMPANY ANALYSIS
- Page 271 and 272:
FRANCE PART 3 (i): COMPANY ANALYSIS
- Page 273 and 274:
FRANCE PART 3 (i): COMPANY ANALYSIS
- Page 275 and 276:
FRANCE PART 3 (i): COMPANY ANALYSIS
- Page 277 and 278:
FRANCE PART 3 (i): COMPANY ANALYSIS
- Page 279 and 280:
FRANCE PART 3 (i): COMPANY ANALYSIS
- Page 281 and 282:
GERMANY PART 3 (i): COMPANY ANALYSI
- Page 283 and 284:
GERMANY PART 3 (i): COMPANY ANALYSI
- Page 285 and 286:
GERMANY PART 3 (i): COMPANY ANALYSI
- Page 287 and 288:
GERMANY PART 3 (i): COMPANY ANALYSI
- Page 289 and 290:
GERMANY PART 3 (i): COMPANY ANALYSI
- Page 291 and 292:
GERMANY PART 3 (i): COMPANY ANALYSI
- Page 293 and 294:
ITALY PART 3 (i): COMPANY AN/ALYSIS
- Page 295 and 296:
ITALY PART 3 (i): COMPANY AN/ALYSIS
- Page 297 and 298:
SPAIN PART 3 (i): COMPANY ANALYSIS:
- Page 299 and 300:
SPAIN PART 3 (i): COMPANY ANALYSIS:
- Page 301 and 302:
THE NETHERLANDS PART 3 (i): COMPANY
- Page 303 and 304:
UNITED KINGDOM PART 3 (i): COMPANY
- Page 305 and 306:
UNITED KINGDOM PART 3 (i): COMPANY
- Page 307 and 308:
UNITED KINGDOM PART 3 (i): COMPANY
- Page 309 and 310:
UNITED KINGDOM PART 3 (i): COMPANY
- Page 311:
UNITED KINGDOM PART 3 (i): COMPANY
- Page 315 and 316:
AUSTRIA PART 3 (ii): COMPANY ANALYS
- Page 317 and 318:
AUSTRIA PART 3 (ii): COMPANY ANALYS
- Page 319 and 320:
AUSTRIA PART 3 (ii): COMPANY ANALYS
- Page 321 and 322:
BELGIUM PART 3 (ii): COMPANY ANALYS
- Page 323 and 324:
ESTONIA PART 3 (ii): COMPANY ANALYS
- Page 325 and 326:
FRANCE PART 3 (ii): COMPANY ANALYSI
- Page 327 and 328:
GERMANY PART 3 (ii): COMPANY ANALYS
- Page 329 and 330:
GERMANY PART 3 (ii): COMPANY ANALYS
- Page 331 and 332:
GERMANY PART 3 (ii): COMPANY ANALYS
- Page 333 and 334:
GREECE PART 3 (ii): COMPANY ANALYSI
- Page 335 and 336:
ITALY PART 3 (ii): COMPANY ANALYSIS
- Page 337 and 338:
ITALY PART 3 (ii): COMPANY ANALYSIS
- Page 339 and 340:
ITALY PART 3 (ii): COMPANY ANALYSIS
- Page 341 and 342:
ITALY PART 3 (ii): COMPANY ANALYSIS
- Page 343 and 344:
SAUDI ARABIA PART 3 (ii): COMPANY A
- Page 345 and 346:
SAUDI ARABIA PART 3 (ii): COMPANY A
- Page 347 and 348:
SPAIN PART 3 (ii): COMPANY ANALYSIS
- Page 349 and 350:
SPAIN PART 3 (ii): COMPANY ANALYSIS
- Page 351 and 352:
SPAIN PART 3 (ii): COMPANY ANALYSIS
- Page 353 and 354:
SPAIN PART 3 (ii): COMPANY ANALYSIS
- Page 355 and 356:
SPAIN PART 3 (ii): COMPANY ANALYSIS
- Page 357 and 358:
SPAIN PART 3 (ii): COMPANY ANALYSIS
- Page 359 and 360:
SPAIN PART 3 (ii): COMPANY ANALYSIS
- Page 361 and 362:
UNITED KINGDOM PART 3 (ii): COMPANY
- Page 363 and 364:
UNITED KINGDOM PART 3 (ii): COMPANY
- Page 365 and 366:
UNITED KINGDOM PART 3 (ii): COMPANY
- Page 367 and 368:
UNITED KINGDOM PART 3 (ii): COMPANY
- Page 369 and 370:
UNITED KINGDOM PART 3 (ii): COMPANY
- Page 371 and 372:
UNITED KINGDOM PART 3 (ii): COMPANY
- Page 373 and 374:
UNITED KINGDOM PART 3 (ii): COMPANY
- Page 375 and 376:
UNITED KINGDOM PART 3 (ii): COMPANY
- Page 377 and 378:
UNITED KINGDOM PART 3 (ii): COMPANY
- Page 379 and 380:
UNITED KINGDOM PART 3 (ii): COMPANY
- Page 381 and 382:
UNITED KINGDOM PART 3 (ii): COMPANY
- Page 383 and 384:
UNITED KINGDOM PART 3 (ii): COMPANY
- Page 385 and 386:
UNITED KINGDOM PART 3 (ii): COMPANY
- Page 387:
UNITED KINGDOM PART 3 (ii): COMPANY
- Page 391 and 392:
PHILIPPINES PART 3 (iii): COMPANY A
- Page 393:
Part 4: Appendix 1 The water cycle
- Page 396 and 397:
PART 4: APPENDIX 1: THE WATER CYCLE
- Page 398 and 399:
PART 4: APPENDIX 1: THE WATER CYCLE
- Page 400 and 401:
370 Pinsent Masons Water Yearbook 2
- Page 402 and 403:
372 Pinsent Masons Water Yearbook 2
- Page 405 and 406:
Private Sector Participation Types
- Page 407 and 408:
PART 4: APPENDIX 2: PRIVATE SECTOR
- Page 409 and 410:
PART 4: APPENDIX 2: PRIVATE SECTOR
- Page 411 and 412:
Water and power contracts compared
- Page 413 and 414:
The private sector’s role PART 4:
- Page 415 and 416:
PART 4: APPENDIX 2: PRIVATE SECTOR
- Page 417 and 418:
PART 4: APPENDIX 2: PRIVATE SECTOR
- Page 419:
Part 4: Appendix 3 The Private Sect
- Page 422 and 423:
PART 4: APPENDIX 3: THE PRIVATE SEC
- Page 424 and 425:
PART 4: APPENDIX 3: THE PRIVATE SEC
- Page 427:
Part 4: Appendix 4 Glossary Of Wate
- Page 430 and 431:
PART 4: APPENDIX 4: GLOSSARY OF WAT
- Page 432 and 433:
PART 4: APPENDIX 4: GLOSSARY OF WAT
- Page 434 and 435:
PART 4: APPENDIX 4: GLOSSARY OF WAT
- Page 436 and 437:
PART 4: APPENDIX 4: GLOSSARY OF WAT
- Page 438 and 439:
PART 4: APPENDIX 4: GLOSSARY OF WAT
- Page 441 and 442:
References And Further Reading PART
- Page 443 and 444:
PART 4: APPENDIX 5: REFERENCES AND
- Page 445 and 446:
PART 4: APPENDIX 5: REFERENCES AND
- Page 447 and 448:
PART 4: APPENDIX 5: REFERENCES AND
- Page 449:
PART 4: APPENDIX 5: REFERENCES AND